Technology shares finally found some footing on Friday after the previous session's heavy selling. The rest of the market was less comfortable. The Nasdaq-100 barely moved, but the S&P 500 fell again. Oil jumped, and Treasury yields recovered part of Thursday's decline. October 23 was a session in which different pressures took turns shaping prices, rather than a convincing end to the market's troubles.
US trading session: October 23, 2026. Research cutoff: 24 October 2026 at 08:42 KST. Equity figures refer to the regular session ending at 4 p.m. New York time. Metals and the dollar have separate observation times below. After-hours stock prices are excluded from the regular-session comparison.
The day beside the recent trend
| Market | October 23 reading | One day | Five sessions | Twenty sessions |
|---|---|---|---|---|
| S&P 500 | 7,623.68 | -0.52% | -0.47% | -1.55% |
| Nasdaq-100 | 28,957.53 | -0.004% | -0.79% | -5.39% |
| Gold futures, labelled December 2026 | $4,010.00/troy ounce | -1.24% | -4.09% | -7.20% |
| Silver futures, labelled December 2026 | $53.960/troy ounce | -1.47% | -5.33% | -16.01% |
| US Dollar Index, DXY | 101.752 | +0.14% | -0.09% | +0.77% |
The five-session comparison starts on October 16; the twenty-session comparison starts on September 25. These are price changes without reinvested dividends. The Nasdaq-100 is distinct from the Nasdaq Composite. Its 1.16-point decline rounds to 0.00% at two decimal places. Closing levels were checked against AP's market tally and Nasdaq-100 historical data.
Gold and silver use Yahoo Finance's daily futures series, not spot bullion. Their last quote timestamps were 4:59:58 p.m. and 4:59:52 p.m. New York time on October 23; DXY's was 4:59:59 p.m. These observations are not presented as official exchange settlement prices. The provider's contract-roll convention can affect longer-period futures comparisons, which are not the returns of a corresponding ETF. Calculation inputs: S&P 500, Nasdaq-100, gold, silver and DXY.
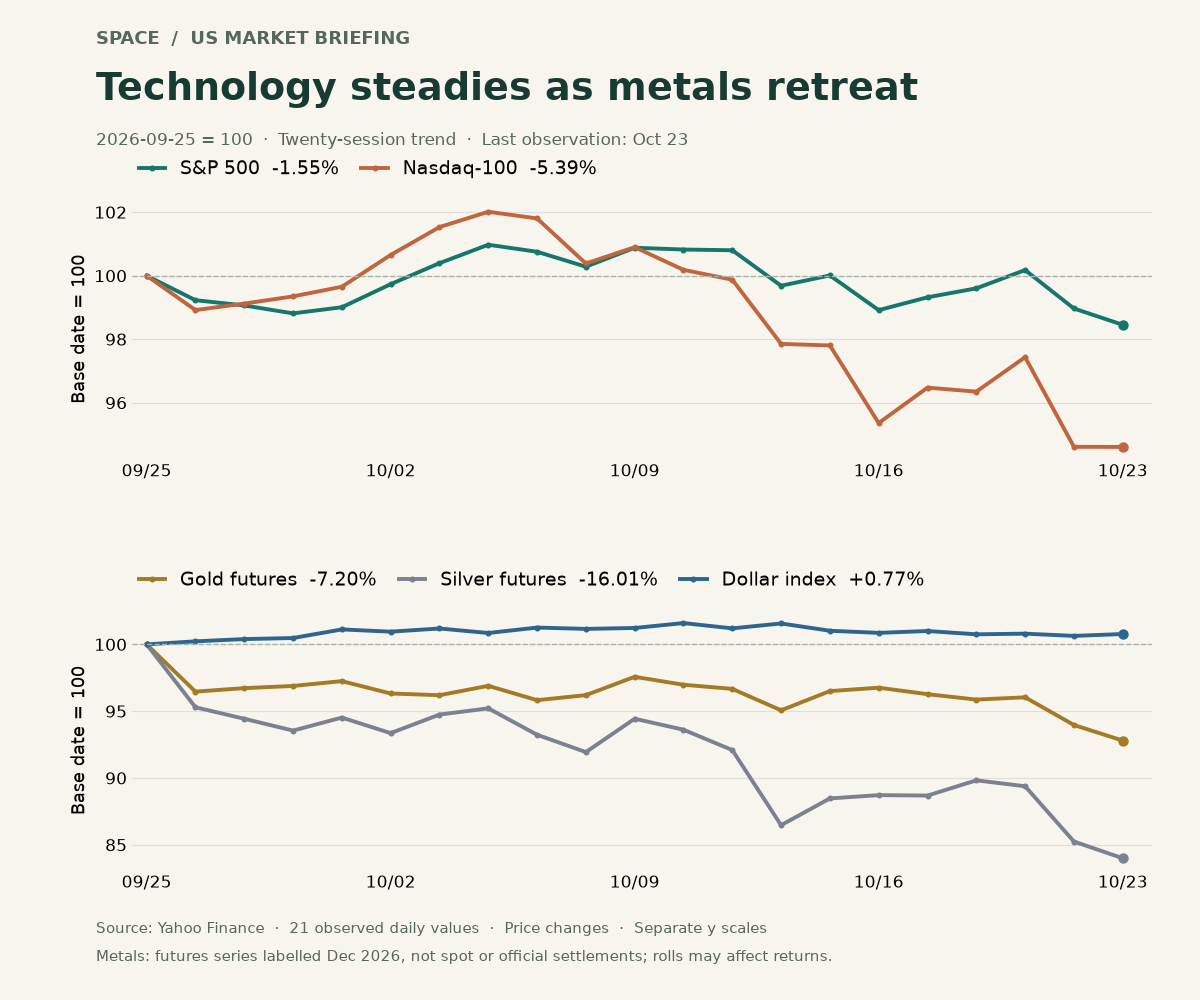
Twenty-one observed daily values, with September 25 set to 100. The panels use different vertical scales; compare the numbers as well as the apparent slopes.
1. A pause in technology selling is not a broad recovery
The Nasdaq-100's almost unchanged Friday close might suggest that the storm had passed. Stretch the view to twenty sessions, however, and it was still 5.39% lower, against a 1.55% decline for the S&P 500. Preventing another day's loss is a different achievement from recovering several weeks of damage. That distinction is easier to see in the path across the chart than in its last point alone.
Microsoft gained 0.66% on Friday while Meta lost 0.96%, according to their daily price records and Meta's series. Technology was hardly moving as one block. Future earnings deserve the same careful reading: rising revenue is only one part of the story. Capital spending happens before a new data center earns its expected cash. A bigger investment budget does not automatically mean a bigger return for shareholders.
Two other measures temper the recovery story. Reuters' final closing report counted 1.72 declining stocks for each advancer on the NYSE and 1.57 on the Nasdaq. The daily VIX series rose to 19.45 from 19.03, an increase of 0.42 point. VIX reflects expected volatility embedded in options, not the probability that stocks will fall. Read alongside market breadth, it suggests that support from some large companies had yet to become widespread strength. Neither measure, by itself, establishes universal panic.
2. Expensive oil does not guarantee more expensive gold
Brent futures settled at $116.72 a barrel, up 3.14%; WTI settled at $103.27, up 3.8%. Reuters linked the move to Houthi attacks in Saudi Arabia and concerns about disrupted Middle Eastern supply. Higher oil prices can help sellers of energy while raising costs for transport companies, manufacturers and households. The same price change travels through different businesses in opposite directions.
Bond yields also moved differently from Thursday. The table uses the Treasury Department's daily series consistently. It should not be expected to match every intraday bond quote down to the last decimal place.
| Rate or economic measure | Latest reading | Comparison | Observation basis |
|---|---|---|---|
| Two-year US Treasury yield | 4.69% | 4.65% previously; +4bp | Treasury daily series, October 23 |
| Ten-year US Treasury yield | 5.00% | 4.96% previously; +4bp | Same basis |
| US flash composite PMI | 57.6 | 58.4 in September | October business survey |
| Michigan consumer sentiment | 48.0 | 48.1 in September | Final October reading |
| Michigan one-year inflation expectations | 4.7% | 4.6% in September | Final October survey |
Sources: US Treasury, TheStreet's account of S&P Global's PMI and the University of Michigan. The PMI issuer's page was inaccessible during this run, so those figures are attributed to the report. Pre-release estimates differed across sources and are omitted.
Four basis points means 0.04 percentage point. If newly available bonds offer a higher yield while an existing bond's promised payments stay fixed, the older bond's price faces downward pressure. But Friday's yield increase cannot all be assigned to oil. A partial reversal of Thursday's rally and interpretations of economic news may also have mattered. The ten-year rate was still nine basis points below its 5.09% reading on October 16. A daily rise can sit inside a weekly decline.
That setting also helps frame weakness in precious metals. Gold pays no interest, so higher yields can increase the opportunity cost of holding it. A stronger dollar can make dollar-priced metals more expensive for buyers using other currencies. These are plausible influences, not verified explanations for every sale. The dollar strengthened on Friday but remained slightly lower over five sessions. A single currency pair, including USD/KRW, cannot substitute for a broader measure of dollar strength.
3. Busy businesses and uneasy consumers can coexist
The flash composite PMI slipped to 57.6 but remained above the 50 threshold separating expansion from contraction. Slower improvement is not the same thing as shrinking activity. Michigan's sentiment index stood at 48.0, but it uses a different scale and asks a different question. Comparing the absolute levels of these two surveys would be misleading.
Sentiment's final reading was above October's preliminary 46.3, while remaining just below September's 48.1. An upward revision within a month is not necessarily a month-to-month improvement. One-year inflation expectations reached 4.7%, and longer-run expectations reached 3.5%; both were 0.1 percentage point above September. Expected inflation is also different from an observed inflation rate. The Michigan release supplies the survey results; Axios supplies the preliminary comparison.
Company accounts call for another useful distinction. In its October 23 release covering the third quarter, oilfield-services company SLB reported revenue of $9.449 billion, GAAP earnings per share of $0.49 and adjusted earnings per share of $0.64. The adjusted figure excludes certain costs, including a pension settlement charge. Both earnings figures describe the same company, but they answer different questions. Adjustments can help readers examine operating performance; they do not make the excluded costs disappear. A supportive oil market and the profit a particular business actually records must be read separately.
4. Large pools of money come with a reporting date
ICI's October 21 release reported $53.26 billion of ETF net issuance for the week ended October 14. Its combined long-term fund figures showed large outflows, but ICI said activity involving collective investment trusts primarily drove the domestic equity mutual-fund outflow, rather than individual redemptions. Treating that figure as Friday's retail panic selling would confuse both the period and the nature of the activity.
The more recent October 22 money-market release showed assets rising by $21.49 billion to $7.94 trillion in the week ended October 21. That is an asset-balance change, not evidence that the same sum left equities and moved into cash. ETF net issuance and growth in a fund's assets are different measures, too. Dates and definitions have to match before the figures can support a story about capital moving from one market to another.
An asset manager's commentary belongs in a third category. Man Group strategist Kristina Hooper publicly raised the possibility of AI data-center investment falling short of earlier projections. That was a view reported by Reuters, not a disclosure that Man Group sold a particular stock on Friday. Public comments can identify useful questions without revealing actual transactions.
The next policy checkpoint is the October 27–28 FOMC meeting. The September 16 decision established a federal-funds target range of 3.75%–4.00%; the next decision has not happened yet. Watch whether oil's rise persists, whether cash generation supports corporate investment budgets, and whether gains spread to more stocks. Progress on one does not automatically resolve the others.
For a Korean investor holding US ETFs, the same reading order is helpful: first understand the underlying assets, then examine the exchange rate and whether currency exposure is hedged. Equity, bond and gold funds share the ETF structure, but their risks reach investors through different channels. Friday's prices are a way to examine those sensitivities, not a ready-made answer about tomorrow.
This briefing is educational market commentary, not a recommendation to buy or sell a particular product.
Sources and session checks
The links above point to reports or data actually read for this briefing. The session was verified against the NYSE calendar and dated closing reports. Regular and extended trading hours follow Nasdaq's published definitions.
Sources
- https://apnews.com/article/e07c72bc5cbe5dffe352ddf30054e35f
- https://uk.investing.com/indices/nq-100-historical-data
- https://query1.finance.yahoo.com/v8/finance/chart/%5EGSPC?range=3mo&interval=1d
- https://query1.finance.yahoo.com/v8/finance/chart/%5ENDX?range=3mo&interval=1d
- https://query1.finance.yahoo.com/v8/finance/chart/GC%3DF?range=3mo&interval=1d
- https://query1.finance.yahoo.com/v8/finance/chart/SI%3DF?range=3mo&interval=1d
- https://query1.finance.yahoo.com/v8/finance/chart/DX-Y.NYB?range=3mo&interval=1d
- https://query1.finance.yahoo.com/v8/finance/chart/MSFT?range=3mo&interval=1d
- https://query1.finance.yahoo.com/v8/finance/chart/META?range=3mo&interval=1d
- https://query1.finance.yahoo.com/v8/finance/chart/%5EVIX?range=3mo&interval=1d
- https://uk.marketscreener.com/news/s-p-500-closes-lower-to-end-rocky-week-ce785cdfdc8bf321
- https://www.marketscreener.com/news/stocks-fall-but-tech-shares-steady-after-selloff-oil-hits-highest-in-nearly-six-months-ce785cdfdc8ff02c
- https://home.treasury.gov/resource-center/data-chart-center/interest-rates/TextView?field_tdr_date_value=2026&field_tdr_date_value_month=202610&type=daily_treasury_yield_curve
- https://pro.thestreet.com/market-commentary/flash-pmi-holds-near-5-year-high-but-prices-jump-the-most-since-2022
- https://www.sca.isr.umich.edu/
- https://investorcenter.slb.com/news-releases/news-release-details/slb-announces-third-quarter-2026-results
- https://www.ici.org/research/stats/combined_flows
- https://www.ici.org/research/stats/mmf
- https://www.federalreserve.gov/monetarypolicy/fomccalendars.htm
- https://www.federalreserve.gov/newsevents/pressreleases/monetary20260916a.htm