A falling US stock market was only part of the story on October 29. The largest indexes retreated while many of their constituent companies advanced. A few enormous ships slowed down; the whole harbor did not stop moving.
The question was more specific than whether a recession was imminent. Could investors keep paying for rapid corporate growth when the cash required to produce it was rising so quickly? Strong economic growth, persistent inflation and falling Treasury yields complicated the answer. These numbers describe different things, over different periods. They deserve to be read that way.
This briefing covers the October 29, 2026 US session, with research frozen at 8:32 a.m. Korea time on October 30. Equity index levels are regular-session closes at 4 p.m. Eastern Daylight Time. Metals, the dollar and Amazon's extended-hours price have separate observation times below. None is described as a final after-hours close.
Look inside the indexes
| Market | Observation | Daily change | Five sessions | Twenty sessions |
|---|---|---|---|---|
| S&P 500 | 7,720.39 | −0.30% | +0.74% | +0.70% |
| Nasdaq-100 | 29,402.51 | −1.38% | +1.53% | −3.60% |
| Gold, December 2026 | $4,024.10 | −0.68% | −0.89% | −4.24% |
| Silver, December 2026 | $51.895 | −3.30% | −5.66% | −15.17% |
| Dollar index, DXY | 101.854 | −0.33% | +0.24% | −0.24% |
Metals are futures quoted in dollars per troy ounce, observed at 7:17:32 p.m. and 7:17:34 p.m. EDT on October 29 respectively. DXY was observed at 6:04:55 p.m. These are neither spot-metal prices nor official futures settlements. Changes compare the final observation with the provider's daily records for October 28, October 22 and October 1. They are not synchronized returns across assets. Equity changes exclude dividends. See the underlying price data and Nasdaq-100 closing cross-check.
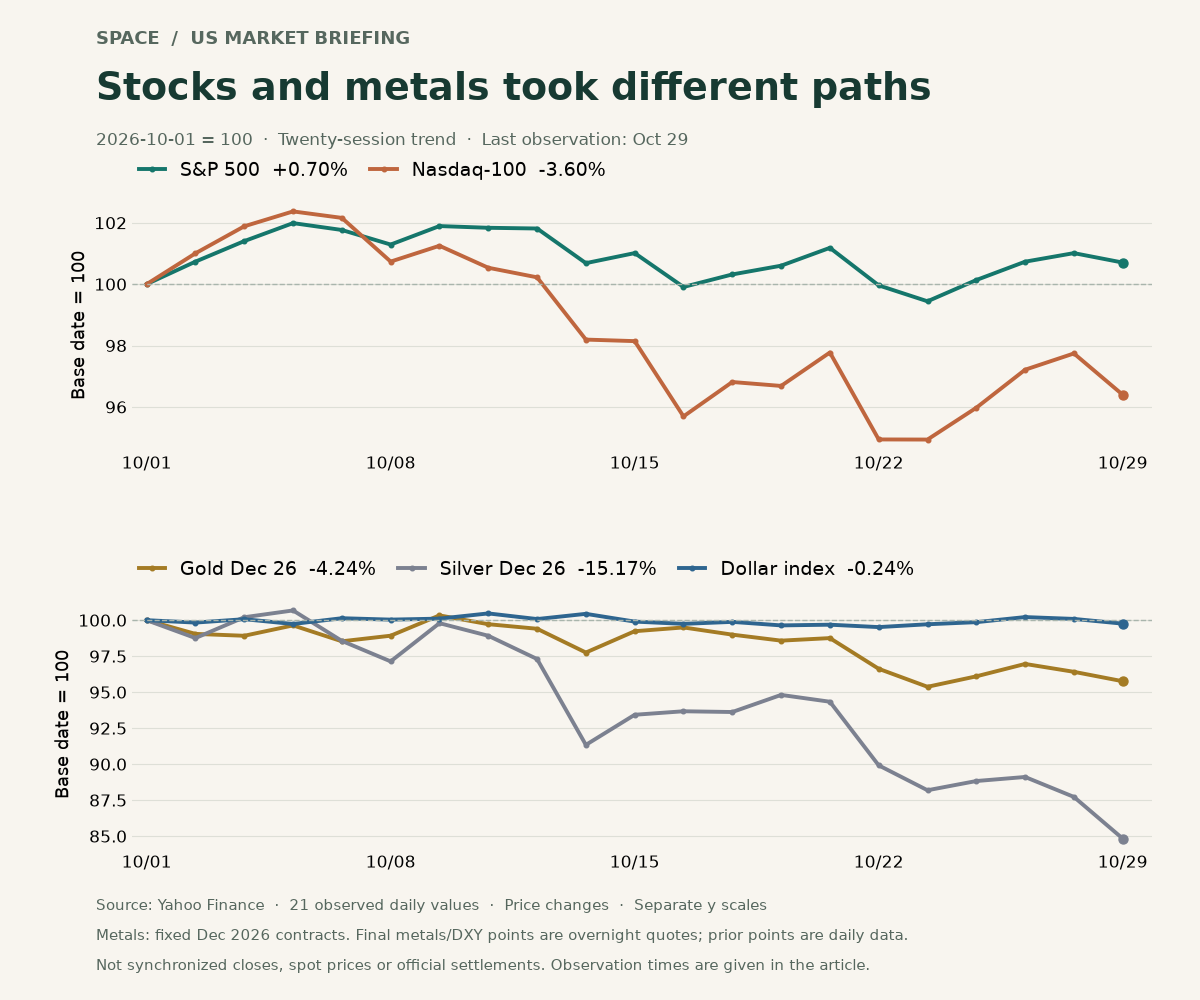
The chart rebases each series to October 1 = 100, using 21 actual daily observations across twenty session intervals. Both metals retain the same December contract throughout. The two panels have separate vertical scales; the final metals and dollar observations carry the timing qualifications above.
AP's closing report said roughly four out of five S&P 500 constituents rose. The small-company Russell 2000 gained 1.01% to 2,859.22. Alphabet Class A, meanwhile, fell 12.64% to $283.82. A company-weighted index can fall even when most companies rise, because its biggest constituents exert much more influence.
That makes a universal market collapse a poor description. It does not establish a lasting small-company leadership cycle either. The Nasdaq-100 remains higher over five sessions but lower over twenty. A short recovery and a longer setback can coexist; choosing only one horizon hides part of the picture.
Alphabet's previous-day release helps explain what investors were weighing. Revenue for the quarter ended September 30 grew 25% from a year earlier, but equipment and property purchases exceeded cash generated by operations. Its October 28 filing showed:
| Alphabet, third quarter 2026 | USD billions |
|---|---|
| Operating cash flow | 42.290 |
| Purchases of property and equipment | 51.355 |
| Free cash flow, a company non-GAAP measure | −9.065 |
Profit and cash answer different questions. A server or building can require cash today while producing revenue over several years. Spending is not automatically evidence of failure. Equally, sales growth does not prove that investment will earn an adequate return. The valuation question is how much to pay for that growth, and how long shareholders must wait for the cash it might eventually produce.
After the close, Amazon brought a similar question into focus. Its October 29 release reported third-quarter AWS sales of $46 billion, up 39.3%. Free cash flow for the trailing twelve months ended September was a $42.4 billion outflow. That period differs from Alphabet's single quarter above; the amounts should not be ranked as though they measured the same interval.
Amazon finished regular trading at $243.79, down 4.25%. At 7:31:25 p.m. EDT, its extended-hours observation was $226.9825, another 6.89% below that regular close. This was an ongoing trading snapshot, not the next session's closing verdict. For index-ETF holders, the episode is a reason to inspect the weight of major companies as well as the number of names in a fund.
Strong growth, sticky prices—and lower bond yields
The advance third-quarter GDP estimate, released at 8:30 a.m. EDT on October 29, put annualized real growth at 3.4%, up from 2.2% in the second quarter. “Annualized” means the quarterly pace is expressed as if it continued for a year. It does not mean output grew 3.4% in three months.
The September income and spending release, published at the same time, showed PCE inflation of 0.5% over the month and 3.6% over the year. Core inflation, excluding food and energy, was 0.3% and 3.1% respectively. Nominal spending rose 0.5%, but inflation-adjusted consumption increased by less than 0.1%. The quarter's growth and the final month's purchasing-power picture are different observations.
Bond yields nevertheless fell.
| US Treasury par yield | October 28 | October 29 | Change |
|---|---|---|---|
| Two-year | 4.67% | 4.61% | −6 basis points |
| Ten-year | 5.05% | 4.98% | −7 basis points |
The Treasury daily series uses indicative bid quotations around 3:30 p.m. Eastern. It has not been mixed with a differently timed live ten-year quote. One basis point is 0.01 percentage point. For a bond promising fixed payments, a higher purchase price means a lower yield for its new buyer.
This does not demonstrate that inflation concerns disappeared. Bonds also reflect expectations already embedded in prices, existing positions and risks elsewhere. Nearly flat real consumption could have attracted caution; some trading could also have reversed the previous day's rise in long yields. The available evidence cannot quantify those contributions. What is established is that the releases and the decline in yields occurred on the same day.
Policy rates require their own timeline. The Fed held its target range at 3.75–4.00% on October 28, a separate decision from the following day's bond-price changes. The ECB held its deposit rate at 2.50% on October 29 and warned that the energy shock threatened higher inflation and weaker growth. Different economic pressures do not, by themselves, establish either central bank's next move.
A softer dollar did not rescue precious metals
DXY measures the dollar against a basket of major currencies; it is not the bilateral dollar–won exchange rate. Its latest observation was lower on the day, higher over five sessions and lower over twenty. “Dollar strength” needs a comparison period before it becomes a useful statement.
A weaker dollar can make dollar-priced gold less expensive for buyers using other currencies. Lower yields can also reduce the interest forgone by holding an asset that pays none. But neither relationship is an automatic pricing rule. Gold and silver were lower alongside the dollar in the observations used here.
Silver's twenty-session loss of 15.17% was much larger than gold's 4.24% decline. A single day's currency move is an inadequate explanation for that gap. Silver has both industrial and precious-metal investment demand, but verified order and positioning evidence would be needed to assign a share of today's decline to either. Profit-taking and forced liquidation have not been inserted as established causes without such evidence.
For a reader who groups gold and silver ETFs together as “safe assets,” the divergence is useful. Actual volatility and a product's holdings matter more than the label. This is a futures-price comparison, not the return of a particular ETF after fees, currency movements or contract-roll effects.
Read anxiety and capital movements separately
Cboe's October 29 VIX reading rose 0.29 point, from 16.91 to 17.20. It reflects expected volatility embedded in S&P 500 options, not a certain prediction of another decline. Alongside the breadth of advancing stocks and small-company strength, it supports a picture of tension concentrated in major technology names coexisting with buying elsewhere.
Institutional cash data offer another perspective, with a different clock. ICI's October 29 report put US money-market fund assets at about $7.90 trillion for the week ended October 28, down $43.29 billion. Institutional fund assets accounted for a $33.66 billion decrease.
Those are changes in asset balances. ICI says they are primarily flow-driven and can serve as a proxy for net new cash flows. They still cannot identify which pension or hedge fund bought a particular stock on October 29, or where the money went. Claiming that institutions financed Thursday's small-company gains by selling Big Tech would stretch this weekly evidence beyond what it establishes.
The next scheduled checkpoint is October 30 at 8:30 a.m. EDT, or 9:30 p.m. the same day in Korea. The BLS calendar lists the third-quarter Employment Cost Index. Watch whether wage and benefit-cost pressures ease, and whether the bond rally persists afterward. The next regular session will also show how investors absorb Amazon's results and whether the gap between large technology companies and other stocks continues.
A useful habit is to place three questions beside each number: what does it measure, which period does it cover, and when was it observed? Comparisons start there. Differences in timing and definition should remain visible rather than being smoothed away.
This briefing is educational market commentary, not a recommendation to buy or sell individual securities.
Sources and calculations
Institutional releases and company filings were read directly. Price calculations use Yahoo Finance's observed daily series for the S&P 500, Nasdaq-100, December gold, December silver and DXY. The official NYSE calendar and dated closing evidence confirmed an open session. Calculations use unrounded observations; reported facts, market responses and possible interpretations are kept separate.
Sources
- https://www.nyse.com/markets/hours-calendars
- https://apnews.com/article/stocks-markets-ai-oil-fed-1b5c71d31b4ce1e46b0db47b33141f6b
- https://www.sec.gov/Archives/edgar/data/1652044/000165204426000080/googexhibit991q32026.htm
- https://ir.aboutamazon.com/news-release/news-release-details/2026/Amazon-com-Announces-Third-Quarter-Results/
- https://www.bea.gov/news/2026/gdp-advance-estimate-3rd-quarter-2026
- https://www.bea.gov/news/2026/personal-income-and-outlays-september-2026
- https://home.treasury.gov/resource-center/data-chart-center/interest-rates/TextView?type=daily_treasury_yield_curve&field_tdr_date_value=2026
- https://www.federalreserve.gov/newsevents/pressreleases/monetary20261028a.htm
- https://www.ecb.europa.eu/press/pr/date/2026/html/ecb.mp261029~9a493adf17.en.html
- https://www.cboe.com/tradable-products/vix
- https://www.ici.org/research/stats/mmf
- https://www.bls.gov/schedule/2026/10_sched.htm
- https://www.marketscreener.com/quote/index/NASDAQ-100-4946/quotes/
- https://query1.finance.yahoo.com/v8/finance/chart/%5EGSPC?range=3mo&interval=1d
- https://query1.finance.yahoo.com/v8/finance/chart/%5ENDX?range=3mo&interval=1d
- https://query1.finance.yahoo.com/v8/finance/chart/GCZ26.CMX?range=3mo&interval=1d
- https://query1.finance.yahoo.com/v8/finance/chart/SIZ26.CMX?range=3mo&interval=1d
- https://query1.finance.yahoo.com/v8/finance/chart/DX-Y.NYB?range=3mo&interval=1d
- https://query1.finance.yahoo.com/v8/finance/chart/AMZN?range=1d&interval=5m&includePrePost=true
- https://query1.finance.yahoo.com/v8/finance/chart/GOOGL?range=3mo&interval=1d