Friday's market asked a demanding question of growth companies: how much will it cost to deliver the future they are promising? The Nasdaq-100 fell 3.46%, while the S&P 500 lost 1.82%. Investors reading Intel and Amazon's results had reasons to look beyond sales toward future earnings and cash. Treasury yields declined, yet gold and silver also fell. The familiar idea that lower yields help growth stocks and gold was not enough to explain this session.
This briefing covers the October 30, 2026 US regular session. After-hours stock prices are excluded. The research cutoff is 2026-10-31 12:41 KST; the observations below have their own stated times.
The session, with a longer view
| Market | October 30 value | Daily | 5 sessions | 20 sessions |
|---|---|---|---|---|
| S&P 500 | 7,580.07 | −1.82% | −0.57% | −1.85% |
| Nasdaq-100 | 28,384.85 | −3.46% | −1.98% | −7.87% |
| Gold, December futures | $3,884.90 | −3.63% | −3.07% | −6.66% |
| Silver, December futures | $49.135 | −6.20% | −8.92% | −18.67% |
| Dollar index, DXY | 101.964 | −0.07% | +0.15% | +0.03% |
Equity indexes use the 16:00 EDT regular close. Metals are fixed December 2026 contracts, quoted in dollars per troy ounce. Their final provider quotes, and DXY's, are timestamped 16:59:59 EDT, or October 31 at 05:59:59 KST. These are not spot metal prices or official exchange settlements, and the observations are not synchronized. DXY measures the dollar against major currencies; it is distinct from USD/KRW.
Five-session changes compare with October 23; twenty-session changes compare with October 2. The chart rebases 21 actual daily observations to 100. That interval is different from the calendar month's return. Sources: Yahoo Finance records for the S&P 500, Nasdaq-100, gold, silver and DXY. The Nasdaq-100 close was also checked against a separate quotation table.
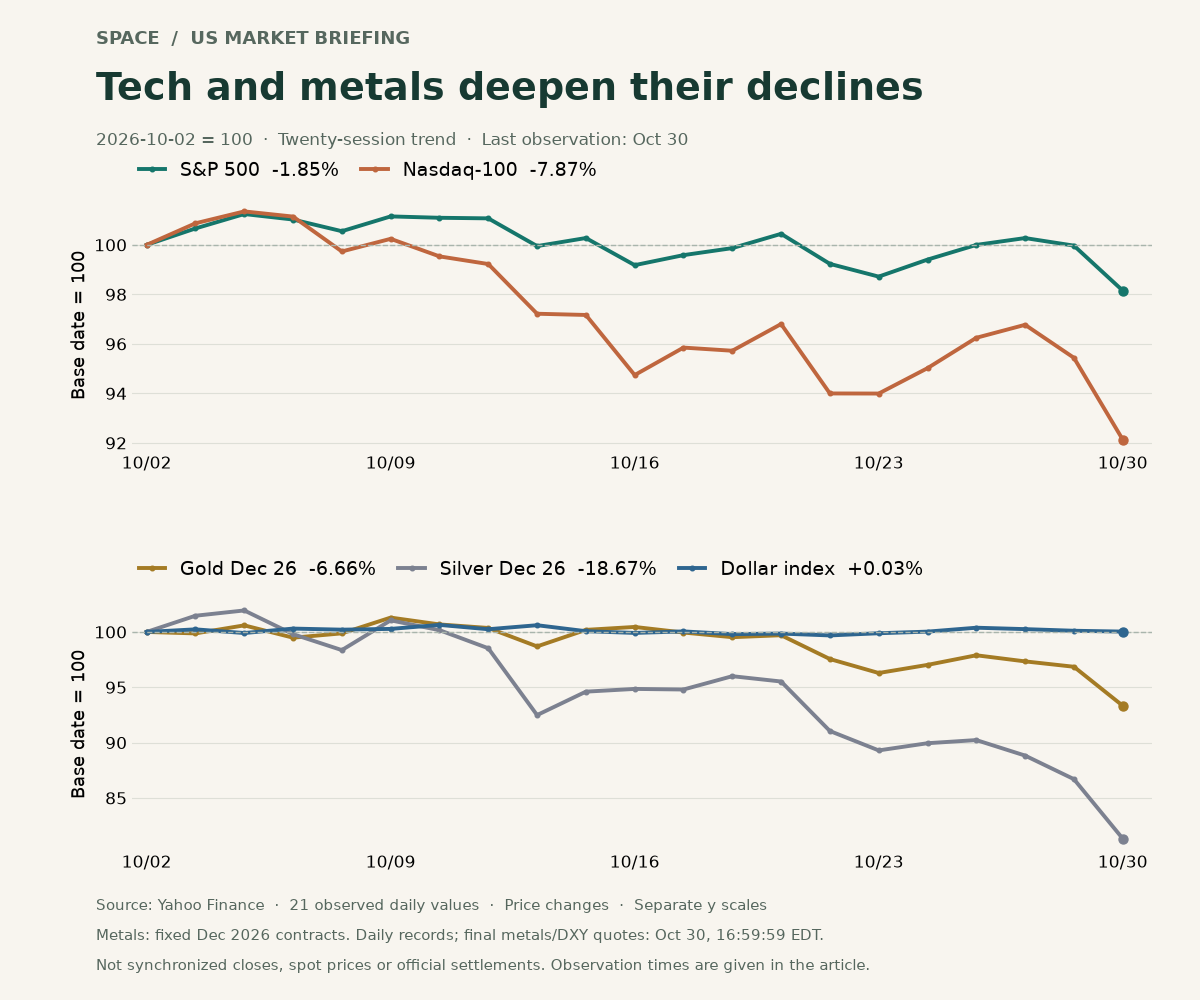
The final downward turn is only part of the story. The S&P 500 stayed much closer to its starting level than the Nasdaq-100, and silver's decline was deeper than gold's. DXY barely changed across the full interval. A stronger dollar alone cannot explain all those differences. Each chart panel has its own vertical scale; compare the percentages rather than the apparent steepness across panels.
1. Strong sales do not settle the question of future earnings
Intel closed at $65.76, down 28.58%. Its prior-day release reported third-quarter revenue of $16.5 billion, up 21% from a year earlier. Yet fourth-quarter adjusted earnings guidance was $0.25 per share, versus an actual $0.52 in the third quarter. Both figures are non-GAAP; one is a forecast and the other a completed result. Management also expected the PC slowdown to persist through at least the first half of next year. Intel release · Regular-session price
A share price is a price on future earnings, not simply a grade for the quarter just completed. Sales can rise while investors become less comfortable with what comes next. No unverified analyst consensus has been inserted here. The directly observed facts are growing revenue, lower earnings guidance for the next quarter, and a large share-price decline. Keeping them separate helps explain why a positive headline about revenue need not produce a positive market reaction.
Amazon presented another version of that tension. Third-quarter AWS revenue reached $46.0 billion, up 39.3%, while trailing twelve-month free cash flow was an outflow of $42.4 billion through September. Amazon attributed the deterioration primarily to increased AI-related capital spending. That is neither a single-quarter loss nor investor money withdrawn on Friday. Shares finished the regular session at $240.35, down 1.41%. Amazon results · Regular-session price
Free cash flow measures the cash remaining after operating cash generation and capital expenditure. It can turn negative while a business builds capacity. The harder question is whether the investment will eventually earn enough to justify its cost. Rising demand and an expensive, lengthy payback period can coexist. Friday's reaction is consistent with investors becoming more demanding about that payback, but it does not prove that the entire AI business case has failed.
2. Bonds gained; a policy-rate cut was not announced
At 08:30 EDT, the BLS released third-quarter employment costs. Civilian compensation rose 0.8% from the previous quarter, slightly slower than 0.9% previously, while annual growth remained 3.4%. These are total compensation costs, including wages and benefits. Quarterly figures are seasonally adjusted; annual figures are not. Slower growth is different from the disappearance of cost pressure. BLS release
| Rates and sentiment | October 29 | October 30 | Change |
|---|---|---|---|
| US two-year Treasury | 4.61% | 4.56% | −5bp |
| US ten-year Treasury | 4.98% | 4.94% | −4bp |
| VIX | 17.20 | 19.42 | +2.22 points |
Treasury figures are official par yields derived from indicative quotations around 15:30 EDT each trading day. A basis point is 0.01 percentage point. VIX uses Cboe's October 30 observation. Sources: US Treasury and Cboe.
For a bond with unchanged promised payments, paying more for it lowers the yield available to a new buyer. Falling yields therefore correspond to higher bond prices. Demand for protection from equity volatility and the slower quarterly rise in employment costs are relevant background considerations. Daily observations cannot tell us how many basis points each explanation contributed. Without a verified pre-release consensus, calling the wage report a downside surprise would go beyond the evidence.
Market yields also differ from the policy rate. On October 28, the Federal Reserve kept its target range at 3.75–4.00%; two members preferred a quarter-point increase. Friday's bond gains did not turn the next Fed decision into a promised cut. FOMC statement A reasonable reading of the session is that concern about corporate earnings and investment costs outweighed the support that lower Treasury yields might otherwise have offered equities.
3. Gold and silver did not provide a daily offset
December gold fell 3.63% and December silver 6.20%. Silver was down 18.67% over twenty sessions, substantially more than gold. Meanwhile, DXY slipped 0.07% on Friday and Treasury yields declined. Explaining the metals sell-off by saying that both the dollar and yields rose would contradict these observations.
In its October 30 commentary, bullion dealer APMEX linked pressure on non-yielding metals to inflation concerns and the possibility of another Fed increase. That is the dealer's interpretation. Its intraday spot quotes and probability estimates have not been mixed into this briefing's table. APMEX commentary The Fed's statement independently confirms that two members favored an increase, but that fact does not establish every cause of Friday's selling.
A decline in yields today can coexist with concern that interest rates will stay high. Price records also cannot identify which fund sold to raise cash or which trader reduced a position. Without transaction evidence, such explanations remain possibilities rather than reported flows. The more secure lesson is that assets with different roles can decline together; owning precious metals does not guarantee an offset to every equity loss.
For an ETF reader, the underlying exposure matters too. A fund holding bullion, one rolling futures, and one owning mining-company shares are not designed to deliver identical returns. The change in a fixed December futures contract is not the return of any particular ETF. Currency exposure, fees and the fund's structure help explain why an account balance may behave differently from a market headline.
4. Anxiety increased, but the market was not uniform
VIX rose 12.91% to 19.42. It reflects the roughly thirty-day volatility implied by S&P 500 options, not a prediction that stocks will fall by that percentage. Cboe explanation and data AP reported that nearly as many S&P 500 stocks rose as fell. Closing report The size of an index decline and the breadth of declining stocks therefore told different stories.
The small-cap Russell 2000 lost 1.66% on the day but gained 1.29% over five sessions. Russell 2000 records Compare that with the Nasdaq-100's five-session loss of 1.98%. Risk appetite weakened, yet meaningful differences remained within equities. A technology-heavy portfolio could experience the session differently from a portfolio spread across industries. Those relative price moves do not measure net inflows into small-cap funds.
The distinction between intention and transaction also matters globally. On October 30, the Bank of Japan maintained its policy rate around 1.25% while announcing an increase in the annual pace of ETF sales from ¥330 billion to ¥860 billion on a book-value basis, effective January 2027. BOJ statement This is a supply plan from a major holder, not an estimate of money withdrawn from US equities that day. It illustrates how a policy-rate decision and a balance-sheet decision can affect markets through separate channels. Actual execution remains something to observe later.
The questions to carry into next week
First, watch spending and payback together. Revenue growth is informative, but so is the point at which cash generation recovers after capital expenditure. Watch whether companies sustain their next-quarter earnings outlooks. Second, watch the breadth of any recovery alongside VIX. A rebound in a few large technology names and a broader improvement across companies are different developments.
Third, follow employment. The BLS schedules September job openings and labor turnover for November 3 at 10:00 EST, and October's employment report for November 6 at 08:30 EST. In Korea those are November 4 at 00:00 and November 6 at 22:30, respectively. Official release calendar The useful question is whether employment cools alongside cost pressure, or whether growth and price pressure remain firm together. Those outcomes would offer different interpretations for stocks and bonds. Neither has yet been reported.
This is an educational market briefing. Separating observed prices, official statements and the interpretation connecting them comes before drawing a trading conclusion.
Sources and calculations
The NYSE calendar, current operational notices and dated closing evidence were checked. Links throughout identify issuer releases, official statistics, price records and attributed commentary. Returns use unrounded observations and exclude dividend reinvestment. Fixed-contract futures and regular-session equity indexes are labeled separately. No after-hours stock quote, anonymous investor motive or unverified daily fund flow has been added.
Sources
- https://www.nyse.com/trade/hours-calendars
- https://apnews.com/article/stock-markets-ai-alphabet-oil-16c266731fdf64178f38070af2b42497
- https://www.intc.com/news-events/press-releases/detail/1786/intel-reports-third-quarter-2026-financial-results
- https://ir.aboutamazon.com/news-release/news-release-details/2026/Amazon-com-Announces-Third-Quarter-Results/
- https://www.bls.gov/news.release/eci.nr0.htm
- https://home.treasury.gov/resource-center/data-chart-center/interest-rates/TextView?type=daily_treasury_yield_curve&field_tdr_date_value=2026
- https://www.federalreserve.gov/newsevents/pressreleases/monetary20261028a.htm
- https://www.cboe.com/tradable-products/vix
- https://www.boj.or.jp/en/mopo/mpmdeci/mpr_2026/k261030a.pdf
- https://www.bls.gov/schedule/2026/11_sched.htm
- https://learn.apmex.com/news/silver-falls-below-50-as-hot-inflation-keeps-a-december-fed-hike-in-play/
- https://www.marketscreener.com/quote/index/NASDAQ-100-4946/quotes/
- https://query1.finance.yahoo.com/v8/finance/chart/%5EGSPC?range=3mo&interval=1d
- https://query1.finance.yahoo.com/v8/finance/chart/%5ENDX?range=3mo&interval=1d
- https://query1.finance.yahoo.com/v8/finance/chart/GCZ26.CMX?range=3mo&interval=1d
- https://query1.finance.yahoo.com/v8/finance/chart/SIZ26.CMX?range=3mo&interval=1d
- https://query1.finance.yahoo.com/v8/finance/chart/DX-Y.NYB?range=3mo&interval=1d
- https://query1.finance.yahoo.com/v8/finance/chart/INTC?range=3mo&interval=1d
- https://query1.finance.yahoo.com/v8/finance/chart/AMZN?range=3mo&interval=1d
- https://query1.finance.yahoo.com/v8/finance/chart/%5ERUT?range=3mo&interval=1d