Good economic news offered little shelter on Wall Street on Thursday. American workers were producing more per hour than economists had expected, yet investors sharply reduced the price they were willing to pay for the future of AI businesses. The S&P 500 fell 4.36% and the Nasdaq-100 lost 6.36%. Gold rose at the comparable observation time. Growth in the economy, expectations for individual companies and willingness to take investment risk were moving at different speeds. US productivity release · Equity observations
| November 5, US session | Level or price | One session | Five sessions | Twenty sessions |
|---|---|---|---|---|
| S&P 500 | 7,353.73 | −4.36% | −4.75% | −5.30% |
| Nasdaq-100 | 26,629.81 | −6.36% | −9.43% | −13.33% |
| December gold | $4,108.70 | +0.84% | +1.85% | −1.19% |
| December silver | $52.060 | −0.47% | −0.63% | −12.44% |
| US Dollar Index (DXY) | 101.596 | +0.09% | −0.43% | −0.49% |
Equities use the regular 4 p.m. New York close, equivalent to 6 a.m. in Korea on November 6. Gold and silver are fixed December 2026 COMEX futures in US dollars per troy ounce. For both metals and DXY, every observation is the first quote of the five-minute bar starting at 4 p.m. New York time. These are snapshots, not futures settlements or final overnight prices. Comparisons start on November 4, October 29 and October 8 respectively. US stock after-hours trading may still be under way when this morning briefing appears in Korea; no after-hours equity prices enter this table. S&P 500 · Nasdaq-100 · Nasdaq's record · Gold · Silver · Dollar index
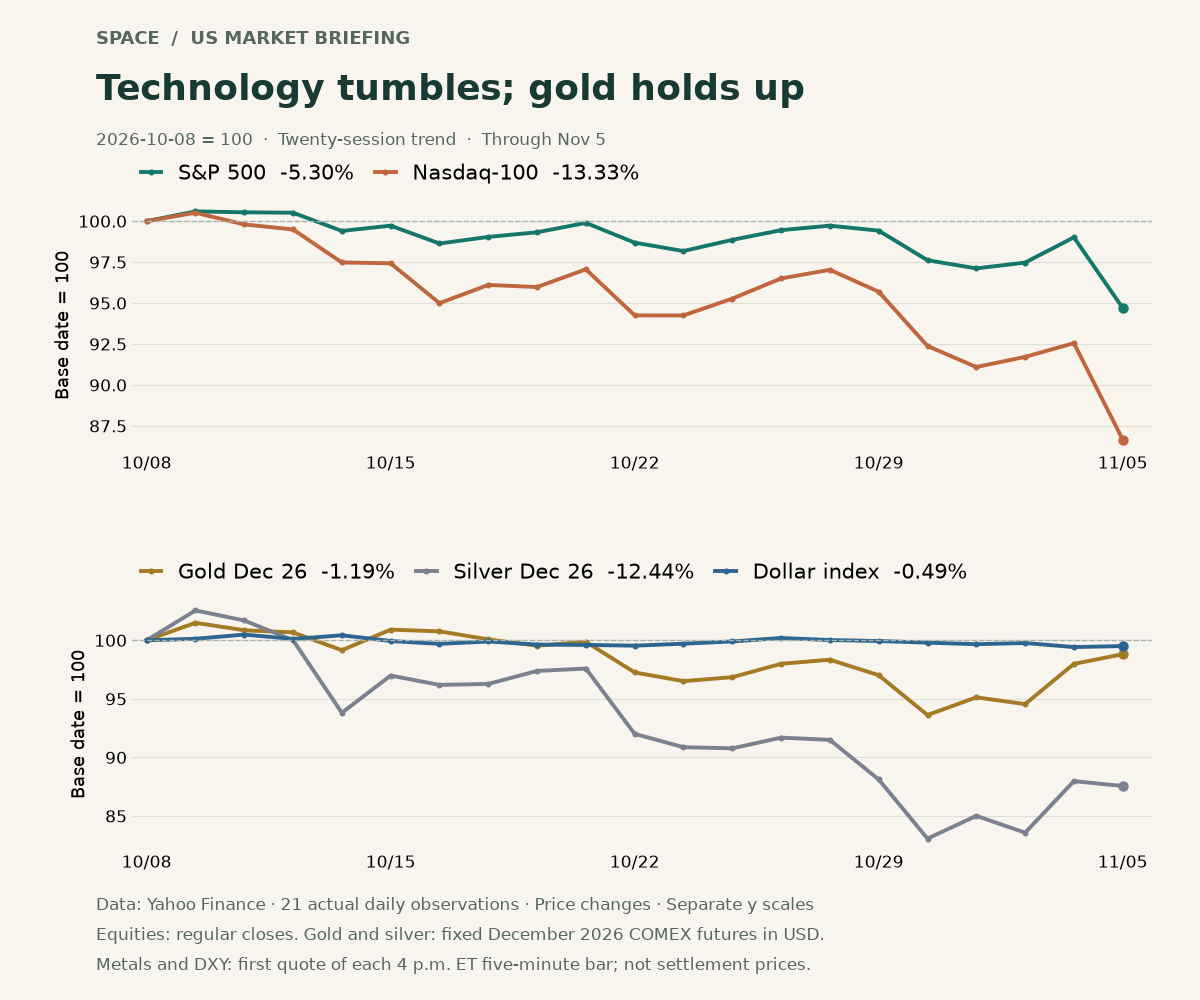
The chart uses 21 actual observations, with October 8 set to 100. From that common starting point, the S&P 500 finished at 94.70 and the Nasdaq-100 at 86.67, excluding dividends. Thursday's drop stands out, but the technology-heavy index had been struggling over a longer stretch. The two panels have different vertical scales: read their numbers and percentage changes rather than comparing the angles of their lines.
The price attached to AI growth changed
Nvidia fell 9.26% to $181.60, while AMD lost 17.26% to $404.40. Neither decline means the company lost that share of its sales in one day. A stock price contains judgments about orders not yet received, profits not yet earned and the risks of waiting for them. When expectations are high, a change in those judgments can produce a much larger change in today's share price. Nvidia regular session · AMD regular session
AP described concern that Democratic election victories could obstruct data-center expansion. That was a reassessment of possible policy, not confirmation of a nationwide construction ban. Closing prices cannot isolate how much of the decline came from that concern. AP market reporting
The unease reached beyond large AI companies. The small-company Russell 2000 fell 4.45%. The VIX finished at 28.18, up 11.57 points from 16.61. This S&P 500 options-based measure has a final observation time of 4:15 p.m. New York, slightly later than the equity closes above. Weak small-company stocks and higher expected volatility together support an interpretation of broader risk aversion. Neither tells us that another decline is inevitable: the cost of protection and the direction of tomorrow's market are different things. Russell 2000 · VIX daily record
AppLovin supplied a striking exception, rising 31.04% to $356.10. Its third-quarter results, released after Wednesday's close, showed revenue of $2.185 billion, up 55% year over year, and net income of $1.439 billion, up 72%. The board also added $3.2 billion to its repurchase authorization. Authorization is permission to buy, not evidence that those purchases have already occurred. An advertising-software company's results and the outlook for AI infrastructure suppliers did not fit a single story. For an ETF investor, that is a reason to inspect holdings and weights rather than rely on a broad “technology” label. Company earnings release · AppLovin regular session
A stronger economy does not guarantee a higher stock price
The Bureau of Labor Statistics released preliminary third-quarter figures at 8:30 a.m. New York time on November 5. Nonfarm business productivity increased at a 3.6% annualized rate, exceeding the 2.8% Reuters poll forecast. Unit labor costs fell instead of rising. These are seasonally adjusted quarterly changes expressed at an annual rate, not changes from the same quarter last year. BLS release · Pre-release expectations
| Third quarter 2026, preliminary | Actual | Reuters poll | Revised second quarter |
|---|---|---|---|
| Nonfarm productivity | +3.6% | +2.8% | +2.1% |
| Unit labor costs | −0.7% | +0.6% | +1.9% |
Producing more goods or services in the same working time can reduce the labor expense assigned to each unit of output. That can help margins and ease price pressure. Even so, unit labor costs were still 2.4% higher than a year earlier. One quarterly decline does not establish that inflation pressure has disappeared. Nor does an improvement across the economy identify how much profit will accrue to a particular AI supplier. That connection must eventually show up in company revenue and costs. Productivity and labor-cost details
The Labor Department's separate weekly report showed 189,000 initial unemployment claims for the week ended October 31, down from a revised 195,000. Continuing claims, which cover an earlier week, rose to 1,718,000 for the week ended October 24 from 1,695,000. New applicants and people still receiving benefits answer different questions. Fewer new claims do not, by themselves, show that everyone looking for another job is finding one quickly. Labor Department release
It would therefore be difficult to explain Thursday's decline simply as an economy suddenly falling apart. Improving productivity and falling growth-stock prices were both observable. Investors consider not just whether business conditions are improving, but how much they have already paid for that improvement.
Bonds and gold held up; silver did not
The Treasury's November 5 daily nominal par-yield data put the two-year yield at 4.46%, down from 4.58%, and the ten-year yield at 4.84%, down from 4.90%. Those declines were 12 and 6 basis points respectively; one basis point equals 0.01 percentage point. When investors pay more for a bond with unchanged promised payments, the yield available at that price falls. Lower Treasury yields provided one sign of defensive assets behaving differently from equities. They do not mean the Federal Reserve cut its policy rate that day. Treasury daily yields
December gold rose 0.84% at our fixed observation time. Lower bond yields can reduce the opportunity cost of holding an asset that pays no interest. Silver, however, lost 0.47% and remained down 12.44% over twenty sessions. It has both precious-metal and industrial uses. Defensive demand and concerns about industrial activity could have pulled differently on the two metals, but these price observations cannot measure or prove the contribution of each explanation. Gold observations · Silver observations
DXY rose just 0.09% on Thursday while remaining 0.43% below its level five sessions earlier and 0.49% below the twenty-session starting point. A small daily recovery can coexist with a weaker recent trend. The index compares the dollar with six major currencies and does not include the Korean won. A Korean investor needs USD/KRW to translate a dollar asset into won. Adding DXY's percentage change to gold's dollar return would not perform that conversion. Dollar-index observations
Across the Atlantic, the Bank of England raised its policy rate from 3.75% to 4.00%. Its decision was published on November 5 after a meeting ending November 4. Eight members supported a 25-basis-point increase; the remaining member wanted 50. The committee was concerned about the inflationary effects of energy costs. Higher British policy rates and lower US Treasury yields can coexist: one is a central-bank decision about its own economy, the other a market yield in a different country. Bank of England decision and minutes
Read the date on the money-flow story
There was also new evidence about institutional cash holdings. ICI's November 5 release put US money-market fund assets at about $8.02 trillion in the week ended November 4, an increase of $114.46 billion. Institutional-fund assets accounted for $102.25 billion of that increase. These are changes in asset balances, not a statement that the entire amount represents equity-sale proceeds or net subscriptions. ICI weekly release
The reporting period ended before Thursday's selloff. It cannot establish that large investors sold stocks that day and parked the proceeds in cash. Nor can an aggregate institutional figure reveal a particular manager's intentions. The larger cash balance is part of the market's background; whether it subsequently returns to riskier assets requires later evidence.
The next checkpoint is the October US employment report, scheduled for November 6 at 8:30 a.m. New York time, or 10:30 p.m. in Korea that day. October consumer-price data are scheduled for November 10 at the same time. Neither had been released at this briefing's research cutoff. BLS release calendar
Watch whether payroll growth and unemployment tell the same story as weekly benefit claims, and whether inflation pressures outside labor costs remain persistent. In equities, a useful question is whether any recovery spreads beyond a few large companies to small stocks and calmer options pricing. Gold's resilience for one day cannot promise protection in every future selloff. Understanding today's evidence is a different undertaking from promising tomorrow's return.
This briefing is for financial education. Read each observation with its stated session, reporting period and time.
Sources
- https://query1.finance.yahoo.com/v8/finance/chart/%5EGSPC?range=3mo&interval=1d
- https://query1.finance.yahoo.com/v8/finance/chart/%5ENDX?range=3mo&interval=1d
- https://query1.finance.yahoo.com/v8/finance/chart/%5EVIX?range=3mo&interval=1d
- https://query1.finance.yahoo.com/v8/finance/chart/%5ERUT?range=3mo&interval=1d
- https://query1.finance.yahoo.com/v8/finance/chart/NVDA?range=3mo&interval=1d
- https://query1.finance.yahoo.com/v8/finance/chart/AMD?range=3mo&interval=1d
- https://query1.finance.yahoo.com/v8/finance/chart/GCZ26.CMX?range=1mo&interval=5m
- https://query1.finance.yahoo.com/v8/finance/chart/SIZ26.CMX?range=1mo&interval=5m
- https://query1.finance.yahoo.com/v8/finance/chart/DX-Y.NYB?range=1mo&interval=5m
- https://query1.finance.yahoo.com/v8/finance/chart/APP?range=1mo&interval=1d
- https://apnews.com/article/stocks-markets-ai-midterm-oil-trump-7ee9c212805aa5e70cf34d25aab7a36e
- https://www.bls.gov/news.release/prod2.nr0.htm
- https://www.investing.com/news/economic-indicators/us-worker-productivity-surges-in-third-quarter-5004543
- https://www.dol.gov/ui/data.pdf
- https://home.treasury.gov/resource-center/data-chart-center/interest-rates/pages/xml?data=daily_treasury_yield_curve&field_tdr_date_value=2026
- https://www.bankofengland.co.uk/monetary-policy-summary-and-minutes/2026/november-2026
- https://investors.applovin.com/news/news-details/2026/AppLovin-Announces-Third-Quarter-2026-Financial-Results/default.aspx
- https://www.ici.org/research/stats/mmf
- https://www.bls.gov/schedule/2026/11_sched.htm
- https://indexes.nasdaq.com/Index/History/NDX