On Friday, November 6, US stocks recovered a small part of the previous day's losses. The Nasdaq-100 gained 1.35%, yet remained 12.61% below its level twenty trading sessions earlier. Seeing a rebound and establishing a recovery are different tasks. Friday illustrated the distance between them.
Employment was stronger than expected. That offered support for household spending and corporate revenue, but also a reason to question how soon interest rates could fall. Semiconductor shares rose alongside the dollar and Treasury yields. Reading stocks alone would miss an important part of the session.
A market dashboard with a consistent clock
The US trading date is November 6, 2026. Equities use their 4 p.m. New York regular-session closes. Gold, silver and the dollar index use the opening observation of each day's five-minute bar beginning at 4 p.m. New York. Those are timestamped observations, not official futures settlements or final after-hours prices. On this date, 4 p.m. New York was 6 a.m. November 7 in Korea.
| Asset | November 6 level | One session | Five sessions | Twenty sessions |
|---|---|---|---|---|
| S&P 500 | 7,376.86 | +0.31% | −2.68% | −5.56% |
| Nasdaq-100 | 26,989.99 | +1.35% | −4.91% | −12.61% |
| Gold, December 2026 | $4,075.30 | −0.81% | +4.69% | −3.43% |
| Silver, December 2026 | $51.970 | −0.17% | +5.22% | −14.76% |
| US Dollar Index, DXY | 102.280 | +0.67% | +0.38% | +0.05% |
Metals are fixed December 2026 COMEX futures, quoted in US dollars per troy ounce. Five-session changes compare with October 30; twenty-session changes compare with October 9. Equity figures measure price changes without dividends. Calculations use the observed S&P 500, Nasdaq-100, gold, silver and DXY series. The dated Nasdaq-100 level was cross-checked against Nasdaq's own data.
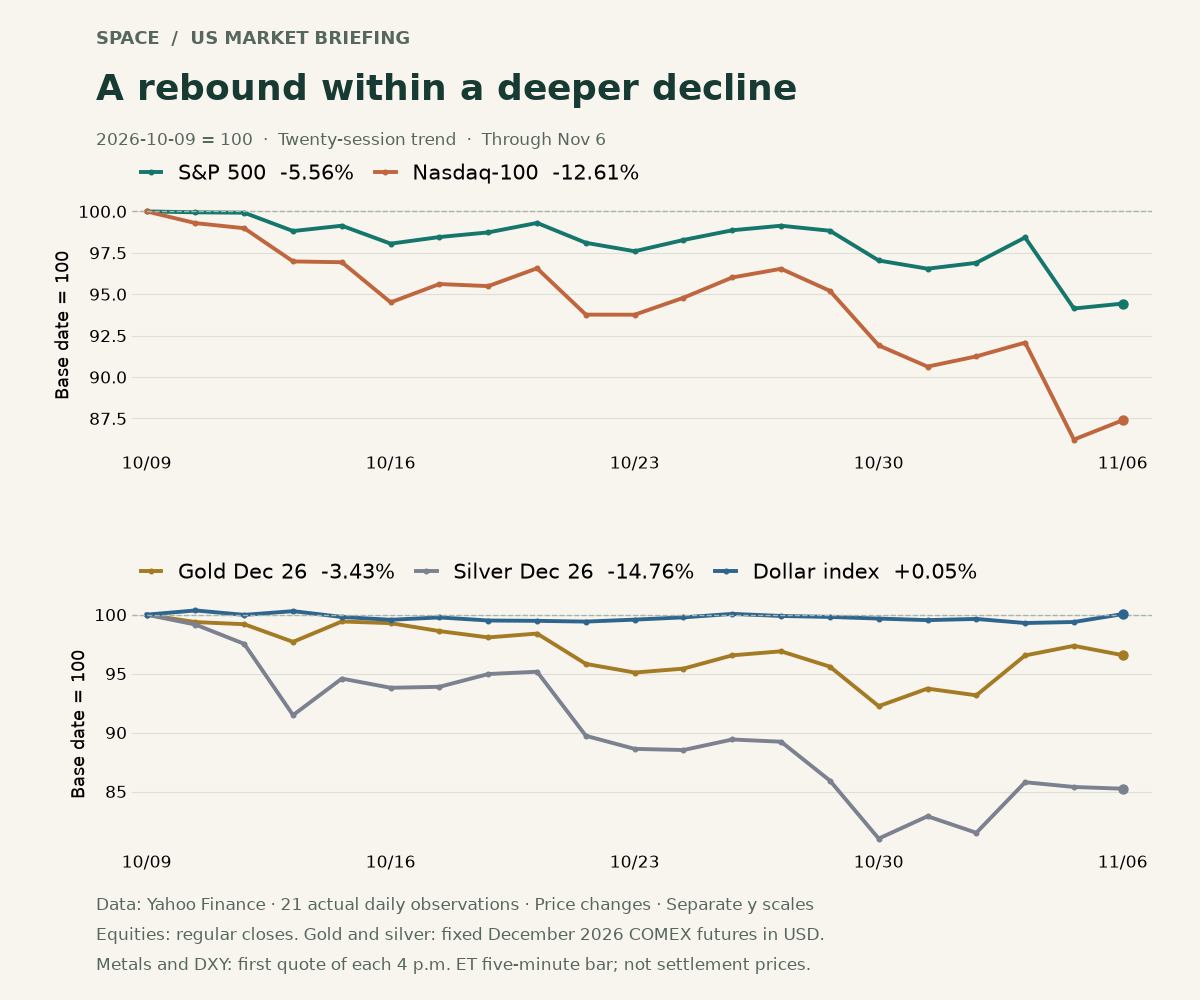
The chart rebases twenty-one actual observations to 100 on October 9. Its two panels have different vertical scales. Before focusing on the small upward turn at the end, follow the path that brought prices there. A single daily return cannot show that history.
Semiconductors recovered; participation remained uneven
Nvidia closed at $186.64, up 2.78%, and AMD at $449.04, up 11.04%. Their twenty-session returns were still −18.60% and −26.16%, respectively. A large daily gain after a steep decline can look more reassuring than the remaining loss warrants. The distance back to the previous price matters as much as the size of today's bounce. Nvidia data, AMD data
Semiconductor equipment maker Lam Research finished at $200.44, up 8.23%. Its November 5 announcement authorized an additional $25 billion in share repurchases. That is permission for future purchases, not evidence that $25 billion entered the stock on Friday. The company says the authorization has no expiration date, can be suspended or changed, and creates no obligation to purchase a particular amount. Share-price data, company announcement
Two measures help assess the mood. VIX, which reflects expected volatility embedded in options prices, declined from 28.18 to 25.64, a drop of 2.54 points, at the 4:15 p.m. New York observation. Tension eased from Thursday. Yet AP's closing report said more S&P 500 constituents fell than rose. The index's advance was not broadly shared. VIX data
Higher headline prices, lower implied volatility and weak breadth can coexist. Together, they suggest a partial recovery in influential technology shares rather than a convincing return of market-wide confidence. That is an interpretation of prices and participation, not proof of any buyer's intentions. For someone following semiconductor ETFs, a rally in prominent holdings and a recovery across the industry are distinct observations.
Strong employment has two sides for investors
The October employment report, released at 8:30 a.m. New York on November 6, showed 165,000 additional nonfarm jobs against a 65,000 Reuters consensus forecast. Combined August and September job gains were revised up by 84,000. Unemployment was 4.1%; average hourly earnings rose 0.4% month on month and 3.1% year on year. BLS release, Reuters expectations and market response
Resilient employment means households still have income to spend. That is welcome for companies worried about demand. But if inflation has not settled sufficiently, the same resilience can reduce the perceived need for lower interest rates. One release can improve expectations for corporate earnings while making investors less willing to pay a high price for those earnings.
The Treasury's November 6 daily par yields were 4.51% for two years and 4.86% for ten years, compared with 4.46% and 4.84% on November 5. Those are increases of 5 basis points and 2 basis points. A basis point is 0.01 percentage point. Rising yields generally put downward pressure on the prices of existing fixed-rate bonds. These daily Treasury observations are separate from the dashboard's 4 p.m. quotes. US Treasury data
Reuters reported that the employment release reinforced dollar strength and expectations of a further rate increase. It also reported New York Fed President John Williams's remarks that day describing economic resilience while emphasizing that inflation remained too high. Remarks and changing market expectations are not an actual policy decision. The report noted that demand for safety had already supported the dollar before the jobs release, so employment alone cannot explain the entire daily move. Reuters
Consumers supplied a different clue. The University of Michigan's preliminary November sentiment index rose to 51.0 from October's 48.0, while one-year inflation expectations declined from 4.7% to 4.3%. Released November 6, the survey covered interviews conducted October 20–November 2. It did not measure reactions after the November 3 election. University of Michigan
Strong hiring and easing inflation expectations can exist together. However, what households expect prices to do is different from what official inflation statistics measure. The useful question is whether coming releases narrow that gap, not whether a single report has settled the next interest-rate decision.
Metals fell on Friday but gained over five sessions
At the consistent 4 p.m. observation, gold fell 0.81%, silver lost 0.17% and DXY rose 0.67%. Higher bond yields can raise the relative cost of holding gold, which pays no interest. A stronger dollar can also make dollar-priced metals more expensive for buyers using other currencies. Friday's directions fit those mechanisms, but a plausible mechanism does not establish the full cause of a price move.
The longer comparison tells another story. Gold gained 4.69% and silver 5.22% over five sessions. Across twenty sessions, they were down 3.43% and 14.76%. Silver's larger weekly rebound did not erase its earlier losses. Calling a market “strong” without stating the starting point leaves out information a reader needs. Gold observations, silver observations
DXY also looked strong on Friday, but its twenty-session change was just +0.05%. It measures the dollar against a basket of major currencies. It is different from USD/KRW and does not imply an identical dollar move against every currency. Dollar-index observations
Money entered gold ETFs while their asset value fell
The World Gold Council's October ETF report, published November 5, offers a useful example of why asset values and flows must be separated. Globally, physically backed gold ETFs received $2.7 billion in net inflows during October. Nevertheless, assets under management fell 6% to $542 billion as lower gold prices outweighed the inflows. World Gold Council
| October gold ETF measure | Monthly net flow |
|---|---|
| Global total | +$2.7 billion |
| Europe-domiciled funds | +$1.8 billion |
| Asia-domiciled funds | +$1.3 billion |
| North America-domiciled funds | −$512 million |
Regions describe fund domicile, not investors' nationality. Other regions and rounding mean the displayed regional figures do not add exactly to the global total. The observation period is October, with an October 31 reference date. This is not a record of trading on November 6.
Assets under management reflect the current market value of holdings. New money can arrive while that value falls if asset prices decline by more. Europe and North America also moved in different directions. The figures do not support a claim that investors everywhere made the same allocation choice. Reading documented flows for their actual measurement period is more useful than assigning a hidden motive to a famous investor.
Questions for the next session
In Korea, the KOSPI had already closed November 6 at 5,059.69, down 6.02%. That session ended before Friday's US employment release and equity rebound. News arriving in the American day cannot explain an earlier Korean decline. The next Korean session will provide an opportunity to observe the competing implications of the semiconductor rebound and higher US yields. KRX's dated market report
The next nearby checkpoint is October CPI, scheduled for November 10 at 8:30 a.m. US Eastern time, or 10:30 p.m. in Korea. It has not yet been released. BLS release calendar
Can inflation ease while employment holds up? Will the technology rebound reach more stocks? Can gold sustain its recent recovery while the dollar and yields rise? The answers need not point in the same direction. On a day when different assets tell different stories, preserving those distinctions is a better starting point than forcing them into one explanation.
This article is for financial education and is not a recommendation to buy or sell any asset.
Sources and measurement
The session was checked against the official NYSE calendar and dated closing evidence. Tables and charts were calculated from the linked releases and observed prices. After-hours prices are excluded from the regular-session equity closes.
Sources
- https://query1.finance.yahoo.com/v8/finance/chart/%5EGSPC?range=3mo&interval=1d
- https://query1.finance.yahoo.com/v8/finance/chart/%5ENDX?range=3mo&interval=1d
- https://query1.finance.yahoo.com/v8/finance/chart/%5EVIX?range=3mo&interval=1d
- https://query1.finance.yahoo.com/v8/finance/chart/NVDA?range=3mo&interval=1d
- https://query1.finance.yahoo.com/v8/finance/chart/AMD?range=3mo&interval=1d
- https://query1.finance.yahoo.com/v8/finance/chart/GCZ26.CMX?range=1mo&interval=5m
- https://query1.finance.yahoo.com/v8/finance/chart/SIZ26.CMX?range=1mo&interval=5m
- https://query1.finance.yahoo.com/v8/finance/chart/DX-Y.NYB?range=1mo&interval=5m
- https://query1.finance.yahoo.com/v8/finance/chart/LRCX?range=1mo&interval=1d
- https://indexes.nasdaq.com/Index/History/NDX
- https://apnews.com/article/markets-japan-nikkei-oil-ai-bba6f0bf9035a6e6b1c4fef3e8230b89
- https://www.bls.gov/news.release/empsit.nr0.htm
- https://www.marketscreener.com/news/dollar-jumps-after-strong-us-payrolls-report-ce785fd2dd81fe27
- https://home.treasury.gov/resource-center/data-chart-center/interest-rates/pages/xml?data=daily_treasury_yield_curve&field_tdr_date_value=2026
- https://www.sca.isr.umich.edu/
- https://newsroom.lamresearch.com/2026-11-05-Lam-Research-Corporation-Announces-25-Billion-Share-Repurchase-Authorization-and-Declares-Quarterly-Dividend
- https://www.gold.org/goldhub/research/gold-etfs-holdings-and-flows/2026/11
- https://www.bls.gov/schedule/2026/11_sched.htm
- https://open.krx.co.kr/contents/MKD/01/0101/01010000/MKD01010000.jsp#view=2026110611
- https://www.nyse.com/trade/hours-calendars