Three funds discuss Nasdaq exposure, yet their distribution figures, expenses and explanations differ. When first comparing JEPQ, GPIQ and QQQI, the largest number can look like the obvious answer. Monthly cash flow, however, reflects both investment activity and distribution policy. Read the contracts behind the cash before ranking the payments.
All three sit where interest in growth companies meets demand for current income. They are not identical Nasdaq-100 investments with monthly interest attached. Stock selection and access to options differ, and those differences can become visible in both rallies and declines.
Separate common ground from different structures
| Fund | Equity and income approach | Annual expenses | Live history begins |
|---|---|---|---|
| JEPQ | Selected growth stocks with option-related exposure through ELNs | 0.35% | May 2022 |
| GPIQ | Nasdaq-100-related equities with adjustable option writing | 0.35% gross; 0.29% net | October 2023 |
| QQQI | Nasdaq-100-related equities with written and purchased NDX calls | 0.68% | January 2024 |
Issuer information was reviewed on October 22, 2026. GPIQ's net figure reflects a contractual waiver through at least April 30, 2027. All three pay monthly, but amounts can change. The expense ratios do not include every investor's taxes, currency conversion or execution spread.
The Nasdaq-100 is an index of large nonfinancial companies. Technology has substantial influence without every constituent belonging to the same industry. JEPQ should not be understood as mechanically replicating every index holding. Actual holdings reveal both the large shared companies and the differences in selection.
ELNs and index options are different instruments
The equity-linked notes used by JEPQ are structured securities issued by financial institutions. They provide option-related exposure while adding issuer-credit, liquidity and valuation considerations. The word “note” should not create an association with the safety characteristics of a government bond.
GPIQ adjusts coverage as it balances premium collection against room for appreciation. QQQI combines written and purchased options to shape outcomes. These descriptions differ from the ELN structure, but neither removes investment risk. The latest prospectus for each fund remains the proper starting point.
 View full-size figure (new tab) ↗
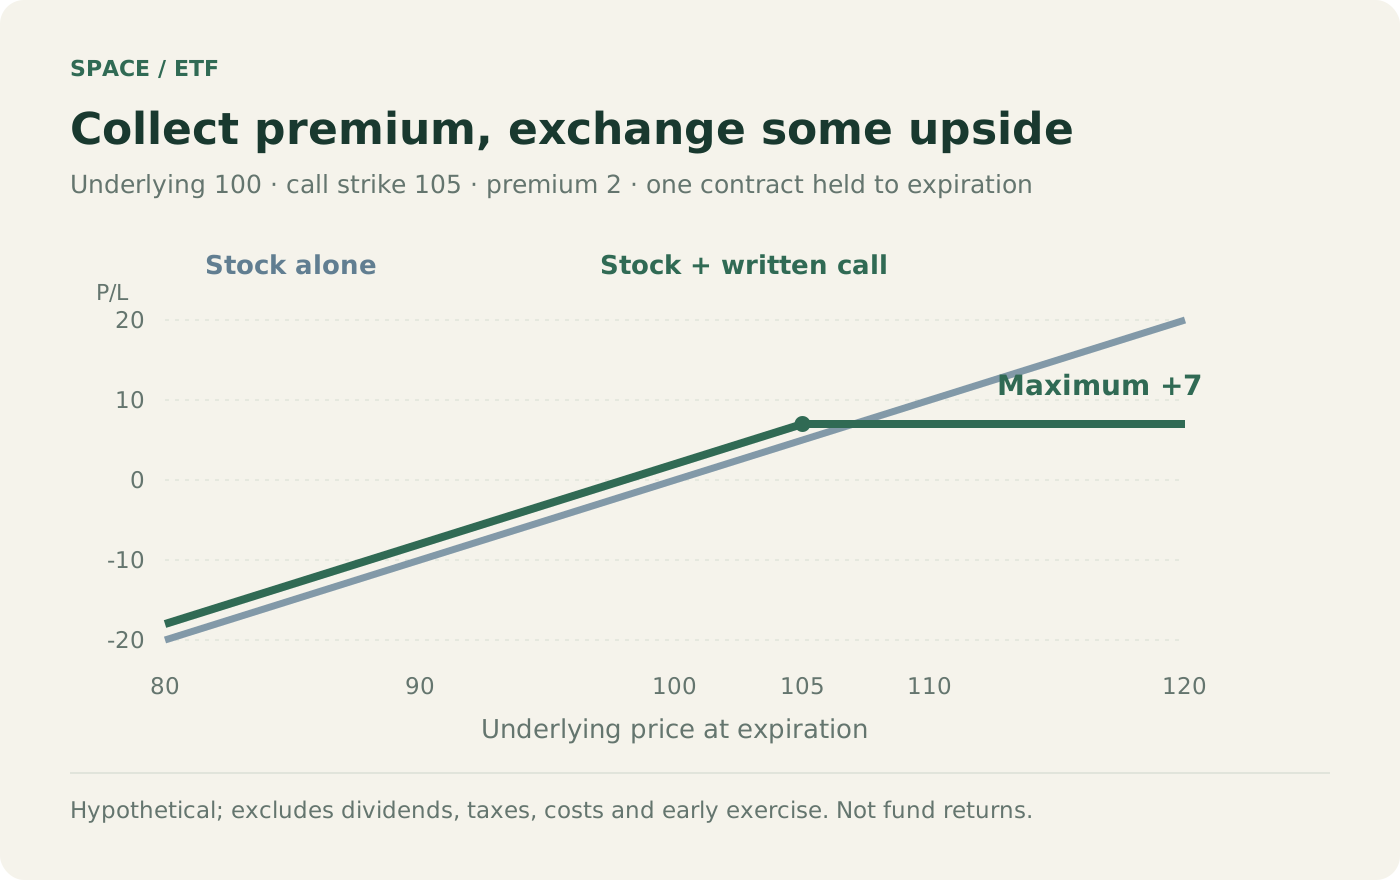
This diagram does not reproduce any of the three funds' actual contracts. It demonstrates one basic exchange. Real strategies change expirations, strikes, weights and trade timing, so a single payoff illustration cannot predict which ETF will lead in a future period.
Why a distribution ranking is not a return ranking
A larger payment puts more cash directly in an investor's hands. Whether it will repeat and how much capital remains after it are separate questions. Reinvested total return brings together distributions and the changing value of the investment.
Do not mix a recent payment multiplied by twelve with an actual twelve-month distribution total. SEC yield is another calculation again. When a distribution rate is high and SEC yield is low or negative, inspect what enters each formula. One number does not automatically disprove the other.
A detailed forecast of future prices and monthly payments can look persuasive down to the last decimal. But constant growth and payment assumptions generate the table. Such scenarios may help explore a plan's sensitivity; they are not guaranteed forecasts from the manager or observations of a future that has already happened.
There is also a double-counting trap. If a published total-return figure already reinvests distributions, adding the distribution rate again inflates the result. Always identify the calculation before using it in a projection or comparison. Precise arithmetic cannot rescue mismatched definitions.
Three tickers can still share one large exposure
If the funds hold many of the same large companies, dividing money among them leaves overlapping economic risks. Lower earnings expectations for those companies, or changing discount rates for growth stocks, can affect all three together. Different managers do not make the underlying businesses independent.
An investor already holding a Nasdaq-100 tracker or US technology shares should examine the combined company exposure after adding another fund. A neat table whose ticker weights sum to 100% does not answer where the money ultimately sits. Adding a distribution mechanism is not necessarily adding diversification.
Put the funds on the same starting line
QQQI began last, in January 2024, so a live comparison of all three must start when all existed. Use consistent dates, currency and reinvestment assumptions, then examine drawdowns and recovery alongside total return. Keep longer simulated histories in a separate category.
Next consider the purpose of current cash and the ability to absorb reduced payments. Someone funding won-based spending must separately consider exchange rates and after-tax receipts. Someone accumulating for a distant goal can ask what a large current distribution contributes to that goal.
The useful conclusion is not a permanent ranking. It is the ability to explain what each fund owns, which contracts it uses, and which risks remain after the cash arrives. That explanation allows the comparison to begin with a purpose rather than with whichever percentage happens to be largest.
Sources and dates
Reviewed on October 22, 2026. Observations belong to the dates stated in the text. Distributions and expenses can change.