If four ETFs all pay monthly, a comparison may appear simple: find the largest payment and the lowest expense ratio. But a payment schedule is the surface of an investment. Restaurants opening at the same hour can serve very different meals. Funds sharing a distribution calendar can hold different assets and contracts.
Putting SPYI, JEPI, DIVO and GPIX into one box labeled “S&P 500 covered calls” erases meaningful differences. They share a US large-cap income theme, but they do not all mechanically track the S&P 500. Begin the comparison with what each fund owns and how it generates income.
Four sets of ingredients
| Fund | Equity foundation | Option-related structure | Annual expenses |
|---|---|---|---|
| SPYI | S&P 500-related equities | Written and purchased SPX index calls | 0.68% |
| JEPI | Selected US large caps, seeking lower volatility | Option exposure through ELNs | 0.35% |
| DIVO | Selected dividend- and earnings-growth companies | Tactical calls on individual stocks | 0.56% |
| GPIX | Stocks drawn from S&P 500 companies | Adjustable option-writing coverage | 0.35% gross; 0.29% net |
Issuer information was reviewed on October 22, 2026. GPIX's net figure reflects a contractual waiver through at least April 30, 2027. These annual fund expense figures exclude personal taxes, currency conversion and brokerage costs. All four distribute monthly without guaranteeing an unchanged amount.
An equity-linked note, or ELN, is a structured security issued by a financial institution. It can provide option-related exposure while adding issuer-credit and liquidity considerations. An individual-stock option is linked to that company; an index option references the broader index. “Uses calls” does not make these instruments identical.
Resembling a market versus choosing companies
For SPYI and GPIX, examine how the option overlay changes a broad equity exposure. For JEPI and DIVO, stock selection deserves additional attention. A portfolio placing substantial weight in a relatively small set of selected companies can follow a different path from the market as a whole.
This does not automatically rank the strategies. Selected companies can outperform or underperform. Lower volatility and dividend growth are objectives or selection characteristics, not guaranteed outcomes. Decide which risks matter before seeing the results; otherwise the criteria can change whenever a different fund leads the table.
Temporarily move distribution rates down the page
A rate annualizing one payment, a trailing twelve-month distribution measure and SEC yield use different calculations. Selecting the largest number on each issuer's website does not create a consistent comparison. Dates must be aligned as well as definitions.
 View full-size figure (new tab) ↗
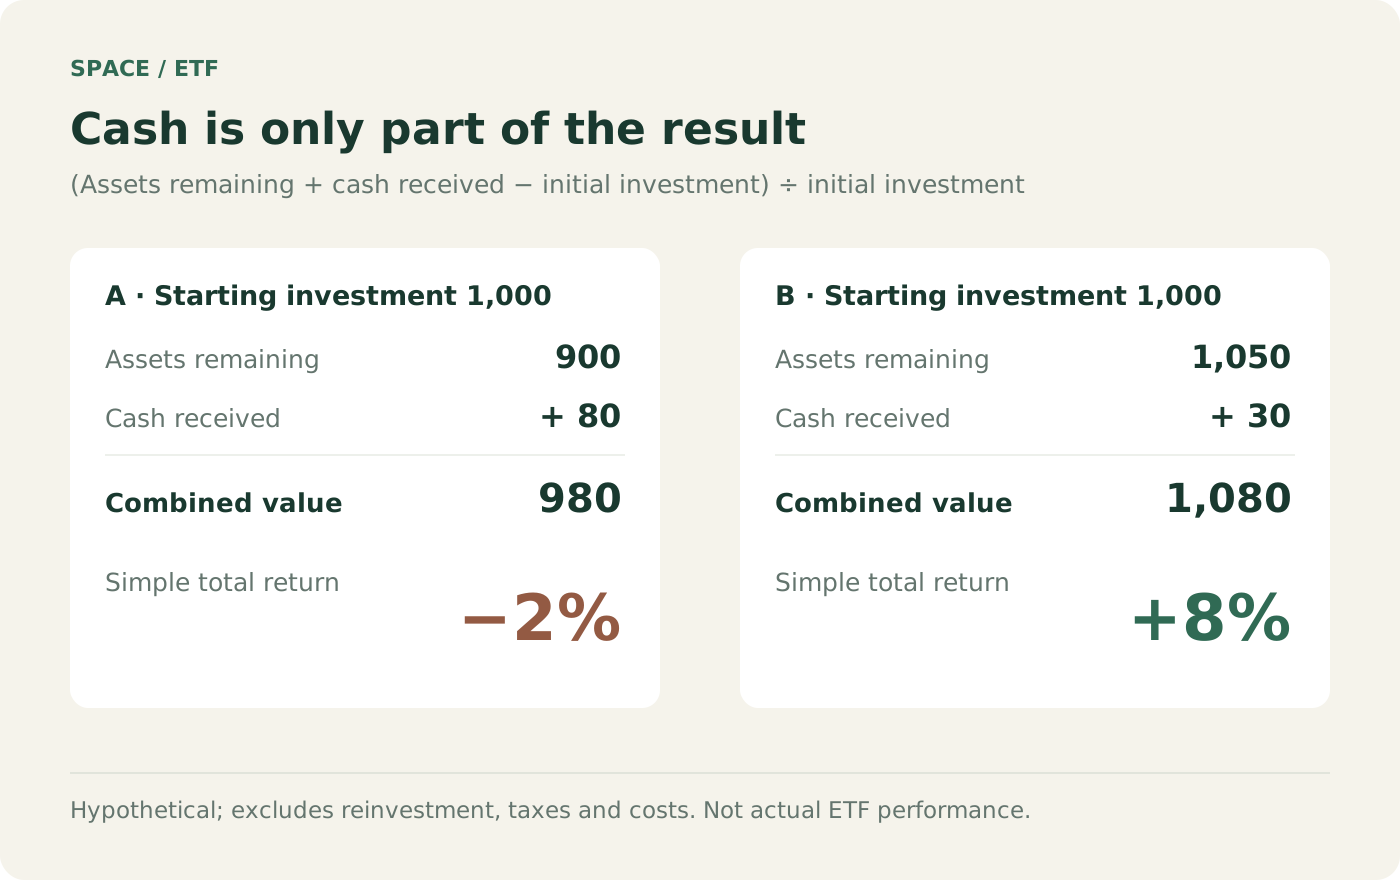
In the hypothetical illustration, investment A pays more cash but loses value overall. B pays less yet delivers a better combined result. These are not rankings of the actual funds. They explain why cash matters without making the capital left behind irrelevant.
Another common mistake is adding a distribution rate to a total-return figure that already includes reinvestment. The payment's effect is already inside that total-return calculation. Adding it again counts the same money twice and creates a result the investor did not earn.
Build a fair performance comparison
Choose a period when every fund actually existed. GPIX launched in October 2023, so a comparison of all four live records cannot begin before then. If a historical index simulation is useful, label it separately instead of presenting it as ETF performance.
Use identical starting and ending dates and consistent dollar-based reinvested returns. Then examine drawdowns and recovery paths. A won-based calculation or a scenario that spends distributions can be added separately. Keeping the layers separate prevents exchange rates, consumption and management results from being confused.
The gap between annual expenses of 0.68% and 0.29% is 0.39 percentage point. On a hypothetical constant $10,000, that is $39 per year. Expenses accumulate, but they do not explain every strategic difference. The least expensive structure and the most suitable exposure are not necessarily the same thing.
Tax descriptions need comparable care. An issuer's US tax discussion is not a universal description of another country's account treatment. Do not build a ranking by comparing after-tax figures for one investor type with before-tax results for another. Use a consistent basis first, then consider the relevant personal circumstances.
Write one sentence before making a selection
Alongside “I want this much monthly cash,” write “I accept these risks and these possible forgone gains to pursue it.” The order of the questions changes with the answer: broad index exposure, stock selection, ELN complexity and concentration are different considerations.
Buying all four does not remove the problem. Large US companies overlap, and the funds can decline together during the same market shock. Different tickers do not necessarily represent independent risks. The purpose of this comparison is to understand the mechanism well enough to describe it clearly, rather than to crown a permanent winner.
Sources and dates
Reviewed on October 22, 2026. Observations belong to the dates stated in the text. Distributions and expenses can change.