The word “fixed” can be reassuring. It may suggest fixed interest, stable payments or capital that moves less. In PLUS High Dividend Weekly Fixed Covered Call, it refers to the option-writing structure. It does not promise an unchanging distribution or protect the principal.
The fund combines Korean high-dividend stocks with a specified amount of KOSPI 200 call writing. Corporate dividends are therefore only one part of the story. Read the stocks and the underlying index of the options separately before combining them into an investment explanation.
Identify the actual product
The trading code is 0018C0. Investors accustomed to all-numeric Korean codes can overlook the letter. Similar product names make the code, listing date and benchmark especially useful for avoiding an accidental comparison with a different fund.
| Item | Information reviewed from the issuer |
|---|---|
| Trading code | 0018C0 |
| Listing date | March 5, 2025 |
| Benchmark | KOSPI High Dividend Weekly Fixed Covered Call index |
| Equity foundation | Korean high-dividend stocks |
| Option underlying / coverage | KOSPI 200 calls / a fixed 30% writing structure |
| Stated annual fund fee | 0.30% |
| Distribution record date | The 15th of each month, subject to the published schedule |
These facts were reviewed against the issuer's 2026 material. The stated annual fee is not an all-in estimate of personal brokerage charges, bid-ask spreads and taxes. Identifying the product correctly is the first step; understanding its exposures is the next.
Thirty percent does not guarantee seventy percent participation
Writing against 30% of an exposure differs from covering the whole portfolio. The idea leaves a portion without the same option constraint. It cannot, however, be translated into a rule that a 10% market rally must produce a 7% fund gain.
Actual results depend on the stocks held, option strikes and expirations, roll timing, premiums and costs. Most importantly, the equity basket and the option's underlying index are not identical. A simple multiplication cannot describe their interaction.
 View full-size figure (new tab) ↗
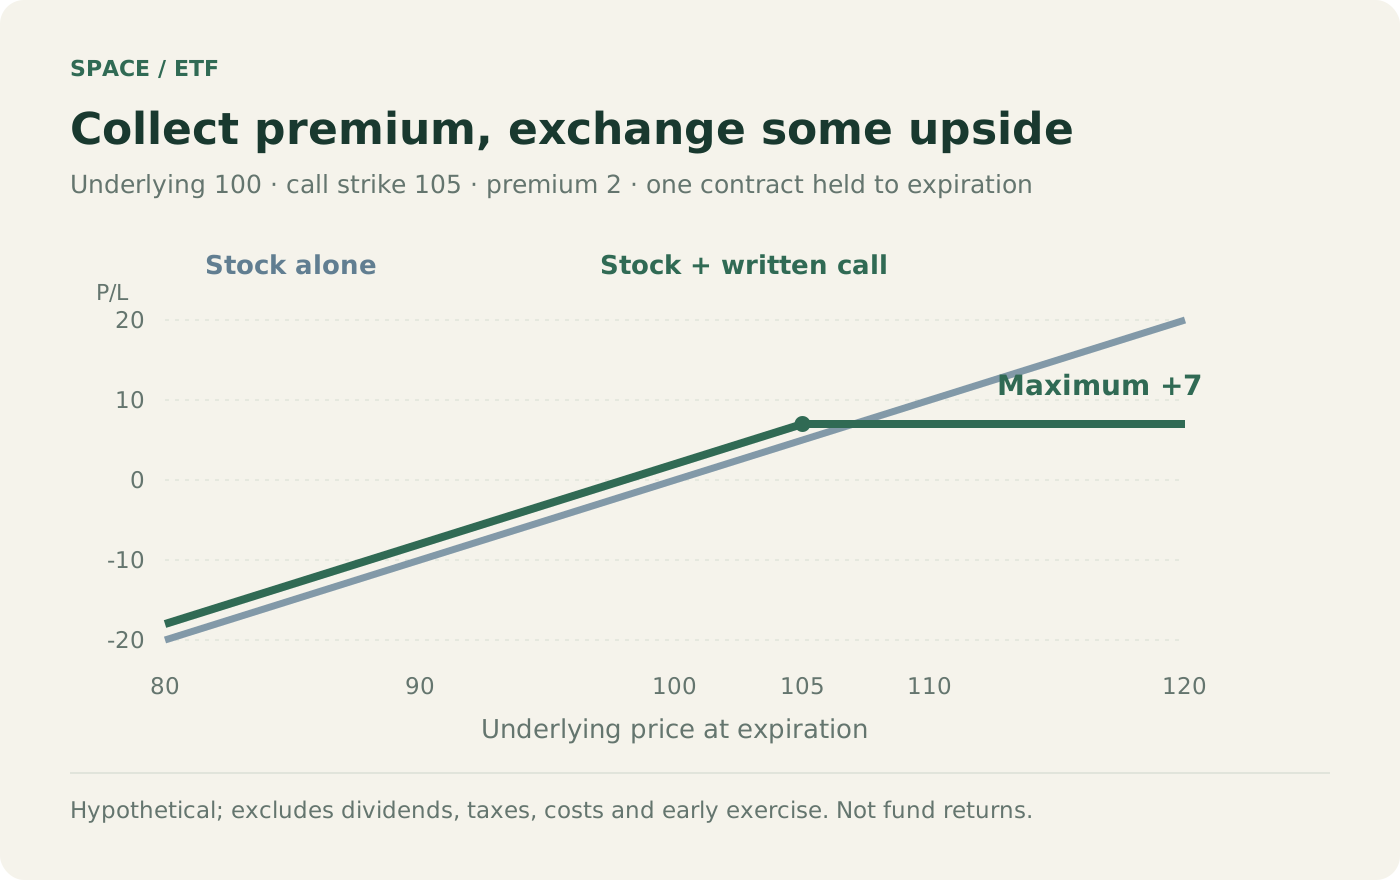
The diagram is a simplified covered call on the same underlying asset. It does not reproduce this fund's 30% structure. Learn the basic exchange first, then add the actual product's coverage and underlying differences. Otherwise a clean teaching diagram can create more confidence than understanding.
When the two baskets move differently
A high-dividend stock portfolio can have different company and sector weights from the KOSPI 200. Imagine large growth companies pushing the index higher while the fund's dividend stocks are weak. The equity gains could be modest or negative while written index calls generate losses.
The opposite can happen as well: the stock basket may outperform the index. The point is not that mismatch always harms the investor, but that it introduces another source of outcomes. Calling the portfolio “safe dividend stocks with extra option income” leaves out this risk.
The size of the difference can also change over time as company prices and index weights evolve. A relationship observed over a few favorable months is not permanent. Reviewing actual holdings helps connect the abstract explanation to the businesses currently driving the portfolio.
A target is different from a promise
An ambitious monthly distribution target can make a product easy to describe, but it does not guarantee each payment. A target or ceiling is also different from the total return actually earned. Market conditions and distribution policy can change; net asset value after the payment remains part of the investment result.
Suppose cash of 100 is received while the value remaining invested falls by 150. The combined result is a loss. The payout size alone cannot establish the health of the portfolio. An investor seeking to preserve capital and an investor willing to spend part of it can interpret the same cash amount differently.
Nor does domestic equity exposure establish that every distribution is entirely tax-free. Applicable taxable amounts and account-specific treatment need separate verification. The mid-month record date is not necessarily the day cash appears in a brokerage account; holidays and processing schedules can affect that timing.
Use only the history that actually exists
Listed in 2025, the ETF has a short live record. Keep historical index simulations separate from actual fund results, and avoid extending one favorable market period into a multiyear promise. Reinvested total return and drawdowns, measured consistently, offer more context than a single payment rate.
The useful words to remember are “30%” and “different underlyings.” Being able to explain those two ideas is a stronger starting point than feeling reassured by “fixed.” Only then does the monthly cash-flow schedule become something an investor can evaluate against a real purpose.
Sources and dates
Reviewed on October 22, 2026. Observations belong to the dates stated in the text. Distributions and expenses can change.