Almost seven in ten members of the S&P 500 rose on Monday. Someone looking only at the index would have seen an early gain of as much as 1.1% disappear and a closing loss of 0.51% at 7,541.40. The two observations fit together. Cheaper oil improved the outlook for fuel buyers, while investors continued to question what the biggest technology companies would earn on their AI spending. AP closing report
The US trading date was November 2, 2026. Regular equity trading ended at 4 p.m. in New York, or 6 a.m. on November 3 in Seoul. Research was checked through 2026-11-03 14:19 KST.
Counting stocks and weighing them
| Measure | November 2 | One session | Five sessions | Twenty sessions |
|---|---|---|---|---|
| S&P 500 | 7,541.40 | −0.51% | −1.76% | −2.99% |
| Nasdaq-100 | 27,989.82 | −1.39% | −4.38% | −9.93% |
| December gold | $3,969.60 | +1.81% | −1.70% | −4.50% |
| December silver | $50.888 | +3.27% | −6.35% | −16.99% |
| US Dollar Index (DXY) | 101.75 | −0.13% | −0.21% | −0.41% |
Five-session changes start at October 26 and twenty-session changes at October 5. Both metals use the same December 2026 COMEX contracts throughout, in dollars per troy ounce. On November 2 the New York settlement windows ran from 1:29 to 1:30 p.m. for gold and 1:24 to 1:25 p.m. for silver. DXY is the daily index observation for that date. Each market keeps its own clock. S&P 500 · Nasdaq-100 · Gold · Silver · DXY · CME settlement times
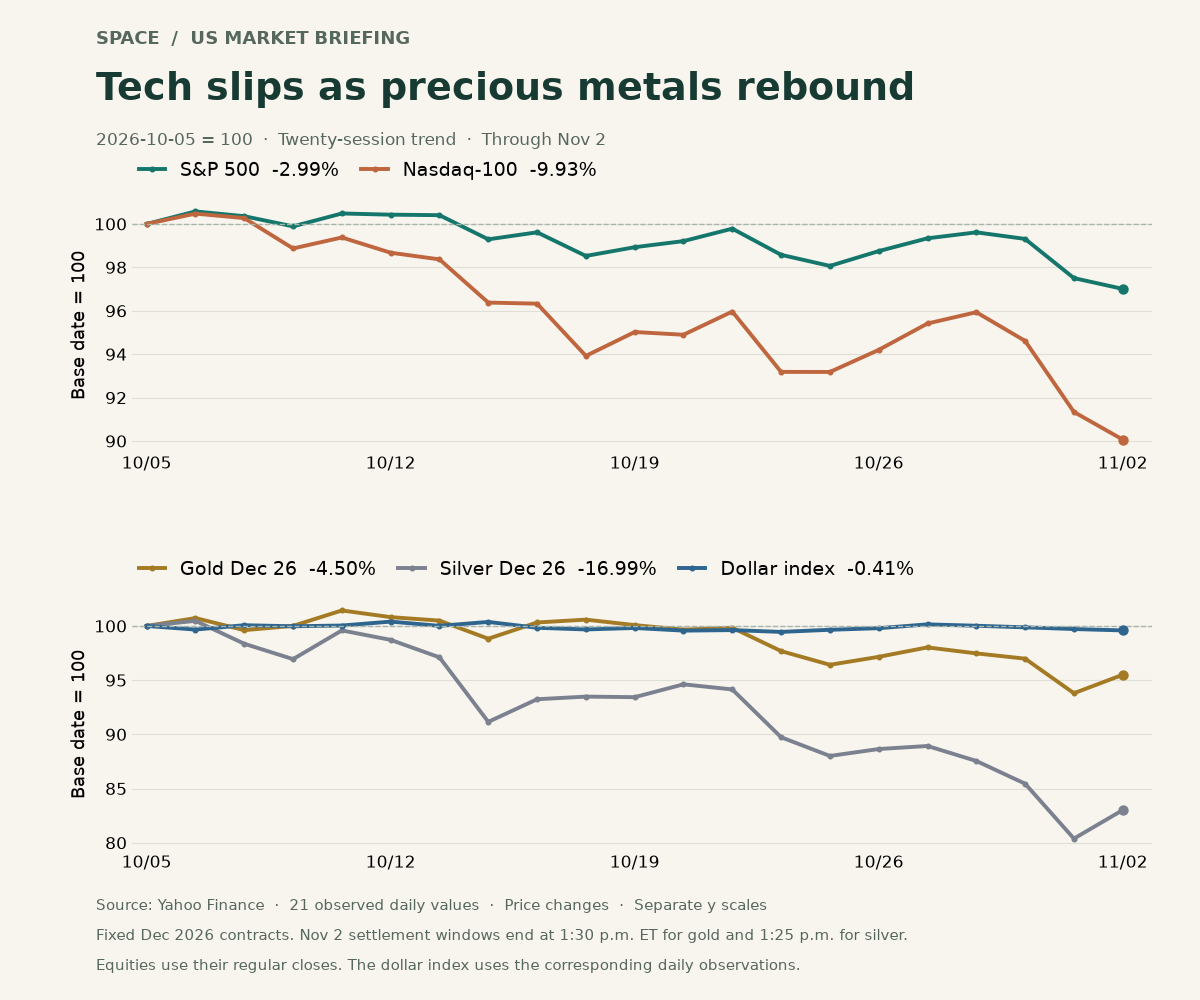
Twenty-one observed daily values start at 100 on October 5. The endpoint of each line corresponds to the twenty-session change in the table. The two panels use different vertical scales. Data from Yahoo Finance, calculations and chart by Space.
A simple three-stock example helps explain Monday's apparent puzzle. Suppose one company accounts for 60% of an index and two others account for 20% each. If the largest one falls 3% while each of the others gains 2%, the index loses 1%. A majority of its stocks rose. A real-world example of the contrast was United Airlines, up 4.8% on a day the Nasdaq-100 lost 1.39%. Across twenty sessions the Nasdaq-100 has lost almost 10%, considerably more than the S&P 500. Investors can own two ETFs tracking US stocks and experience quite different swings simply because of the weights of their holdings. AP · Nasdaq-100 history
The options market put a price on the uncertainty. The VIX, an estimate of expected volatility over roughly the next 30 days derived from S&P 500 options, rose 1.73 points, from 19.42 on Friday to 21.15 on Monday. Broad participation in gains can coexist with greater demand for protection against a large index move. The VIX measures the size of the swings priced by options and leaves the direction open. Cboe daily VIX history
Why both sides of a chip deal fell
Marvell agreed to acquire optical components maker Lumentum in an all-stock transaction. A data center needs to move information between chips fast enough to keep those chips busy. Marvell sees a commercial opportunity in designing its semiconductors and Lumentum’s optical technology together. Yet Marvell finished the regular session down 12.72% at $171.41, and Lumentum fell 18.59% to $684.40. Joint announcement · Marvell history · Lumentum history
The deal terms explain why both share prices could fall together. At completion, each Lumentum share would convert into 4.5 Marvell shares. Using October 28 prices, the companies put the implied value at about $1,132 per Lumentum share. Apply the very same ratio to Monday's Marvell close and the value becomes approximately $771.35. The number of shares promised stays fixed while their dollar value moves. The companies expect to complete the transaction in the first half of 2028, subject to shareholder and regulatory approvals. The difference between $771.35 and Lumentum's $684.40 closing price therefore has time and completion risk attached. Transaction terms and expected timetable
Apple offers a different lesson about timing. Its shares closed at $338.32, down 1.83%. After the bell, it reported sales of $114.5 billion for the quarter ended September 26, up 12% from a year earlier, and diluted earnings of $2.10 per share. Tariff refunds contributed $0.05 to that earnings figure. Investors evaluating the following session can separate that contribution from the earnings generated by selling products and services. The results were still ahead of the market when Monday’s regular-session price was set. Apple earnings release · Apple regular closes
More factory output, a narrower yield gap
The October ISM manufacturing PMI, released at 10 a.m. New York time on November 2, came in at 55.5. September's reading was 54.5 and the pre-release consensus recorded by TD Economics was 54.7. Production climbed from 56.7 to 59.0. The prices index, meanwhile, eased from 77.9 to 75.2. The latter is a diffusion index. A reading that far above 50 still indicates that rising input costs were more widespread than falling costs, even though the balance of responses eased. ISM report · TD pre-release calendar
The same data-center order looks different on the balance sheets of the two businesses involved. For the factory supplying the equipment it can mean another production shift. For the customer buying the equipment it means spending cash before knowing the return. That timing difference helps explain how manufacturers could report stronger output while investors questioned the price of technology shares.
| US Treasury par yield | October 30 | November 2 | Change |
|---|---|---|---|
| Two-year | 4.56% | 4.59% | +3bp |
| Ten-year | 4.94% | 4.91% | −3bp |
| Ten-year less two-year | 38bp | 32bp | −6bp |
Treasury estimates these yields using market quotations around 3:30 p.m. in New York. One basis point equals 0.01 percentage point. Short yields are sensitive to near-term monetary policy, while longer ones also reflect years of expected inflation and bond supply. On Monday the two ends moved toward each other. An existing fixed-rate bond's price moves in the opposite direction to its yield, which helps explain why two bond ETFs holding different maturities might have experienced the session differently. Treasury yield data
Treasury also projected $618 billion in privately held net marketable borrowing for the fourth quarter. The estimate is $10 billion below its August projection, mainly because it began the quarter with more cash than expected. Its assumed year-end cash balance is $850 billion. The lower borrowing estimate by itself says little about a change in government spending. Treasury plans to provide further financing details on November 4 at 8:30 a.m. EST, or 10:30 p.m. in Seoul. Those details will help investors assess the mix of maturities they may be asked to absorb. Treasury borrowing release
Silver’s daily gain sits inside a much larger decline
December West Texas Intermediate crude fell 7.36% to $96.46 per barrel as hopes for negotiations in the Middle East grew. Oil is a cash expense for transport operators and an input into investors' inflation expectations. In the metals market, Reuters reported that cheaper oil eased some inflation concerns and that a softer dollar offered support to gold. Since gold pays no interest, the return available on an alternative interest-bearing asset can affect what a buyer is willing to pay to hold it. December WTI · Reuters metals report
The longer comparison puts a limit on that explanation. Over twenty sessions the dollar index slipped 0.41%, yet gold fell 4.50% and silver 16.99%. Monday's 3.27% gain in silver lifted it from a much lower starting point. For a reader in Korea there is a further timing difference. Before US equities opened, the November 2 Seoul daytime dollar quote at 3:30 p.m. KST had risen by 9.50 won to 1,343.80 won. That bilateral exchange rate and New York’s basket-based DXY measure different currencies at different times. Gold · Silver · US Dollar Index · Seoul FX close
Fund flows tell a story over a different interval again. ETF.com's October figures, published November 2, put net inflows to US-listed ETFs at $204.3 billion. The iShares Semiconductor ETF, SOXX, received about $3.3 billion in net flows over the month, while SPDR Gold Shares, GLD, saw roughly $1.8 billion leave. These amounts measure money entering or leaving fund shares across October. They do not identify the buyers of Monday's gold futures or the orders of an individual asset manager that day. October fund-flow report
In the next session, watch whether fuel-sensitive stocks can hold their gains and whether the gap between the Nasdaq-100 and S&P 500 narrows after investors have read Apple’s results. The US October employment report is due on November 6 at 8:30 a.m. EST, or 10:30 p.m. in Seoul. It will offer a check on whether the stronger industrial activity seen in the survey also appears in hiring, and on how the two-year Treasury yield responds. BLS release calendar
This briefing is an educational reading of public market data.
Sources
- https://apnews.com/article/stocks-markets-ai-earnings-oil-iran-048328e49e47ce7afe6c1fb9d9acf13d
- https://cmegroupclientsite.atlassian.net/wiki/spaces/EPICSANDBOX/pages/457085528/Daily%2BSettlement%2BTime%2BDetails
- https://cdn.cboe.com/api/global/us_indices/daily_prices/VIX_History.csv
- https://investor.lumentum.com/financial-news-releases/news-details/2026/Marvell-and-Lumentum-to-Combine-Creating-a-Category-Leader-in-AI-Connectivity/default.aspx
- https://www.apple.com/newsroom/2026/11/apple-reports-fourth-quarter-results/
- https://www.ismworld.org/supply-management-news-and-reports/reports/ism-pmi-reports/pmi/october/
- https://economics.td.com/domains/economics.td.com/documents/reports/bottom-line/tables/2026-10-30/upcoming.htm
- https://home.treasury.gov/resource-center/data-chart-center/interest-rates/pages/xml?data=daily_treasury_yield_curve&field_tdr_date_value=2026
- https://home.treasury.gov/news/press-releases/sb0675
- https://www.marketscreener.com/news/gold-rebounds-from-one-year-low-as-oil-slides-ahead-of-us-midterms-ce785fd8de8fff24
- https://news.einfomax.co.kr/news/articleView.html?idxno=4442591
- https://www.etf.com/sections/monthly-etf-flows/etfs-pull-204b-october-despite-rocky-month
- https://www.bls.gov/schedule/2026/11_sched.htm
- https://query1.finance.yahoo.com/v8/finance/chart/%5EGSPC?range=3mo&interval=1d
- https://query1.finance.yahoo.com/v8/finance/chart/%5ENDX?range=3mo&interval=1d
- https://query1.finance.yahoo.com/v8/finance/chart/GCZ26.CMX?range=3mo&interval=1d
- https://query1.finance.yahoo.com/v8/finance/chart/SIZ26.CMX?range=3mo&interval=1d
- https://query1.finance.yahoo.com/v8/finance/chart/DX-Y.NYB?range=3mo&interval=1d
- https://query1.finance.yahoo.com/v8/finance/chart/AAPL?range=3mo&interval=1d
- https://query1.finance.yahoo.com/v8/finance/chart/CLZ26.NYM?range=3mo&interval=1d