A large number naturally draws the eye. A distribution rate around 12% becomes even more striking beside the familiar S&P 500 name. But translating those two facts into “own leading American companies and earn 12% every year” combines information that does not make that promise.
SPYI is the NEOS S&P 500 High Income ETF. It uses equities and index options to pursue monthly cash flow. To understand the payments, separate company dividends, gains and losses from option transactions, and cash distributed to shareholders. They are related, but they are not interchangeable.
The options beside the stock portfolio
The strategy combines an S&P 500 equity portfolio with SPX index options. It can use purchased calls as well as written calls. Written options generate premiums; purchased options cost money. Including purchased calls does not establish unlimited participation in every possible market rally.
| Item | Information reviewed from the issuer |
|---|---|
| Ticker / inception | SPYI / August 29, 2022 |
| Annual expenses | 0.68% |
| Equity / options | S&P 500-related stocks / SPX index options |
| Payments | Monthly, without a fixed guaranteed amount |
| Distribution rate | 12.21%, September 30, 2026 |
| Trailing 12-month distribution rate | 12.09%, same date |
| 30-day SEC yield | 0.45%, same date |
Seeing 12.21% and 0.45% on one page does not mean one number is erroneous. They use different definitions. The distribution rate annualizes a recent payment, while the trailing measure looks at payments already made. SEC yield is a standardized net-investment-income measure; it is not a substitute for all distributed cash or total return.
These September observations were reviewed on October 22, 2026. They do not establish what someone buying today will receive over the next twelve months. Mixing a price from one date with payments from another can also create a misleading new calculation.
A cash deposit can coexist with a loss
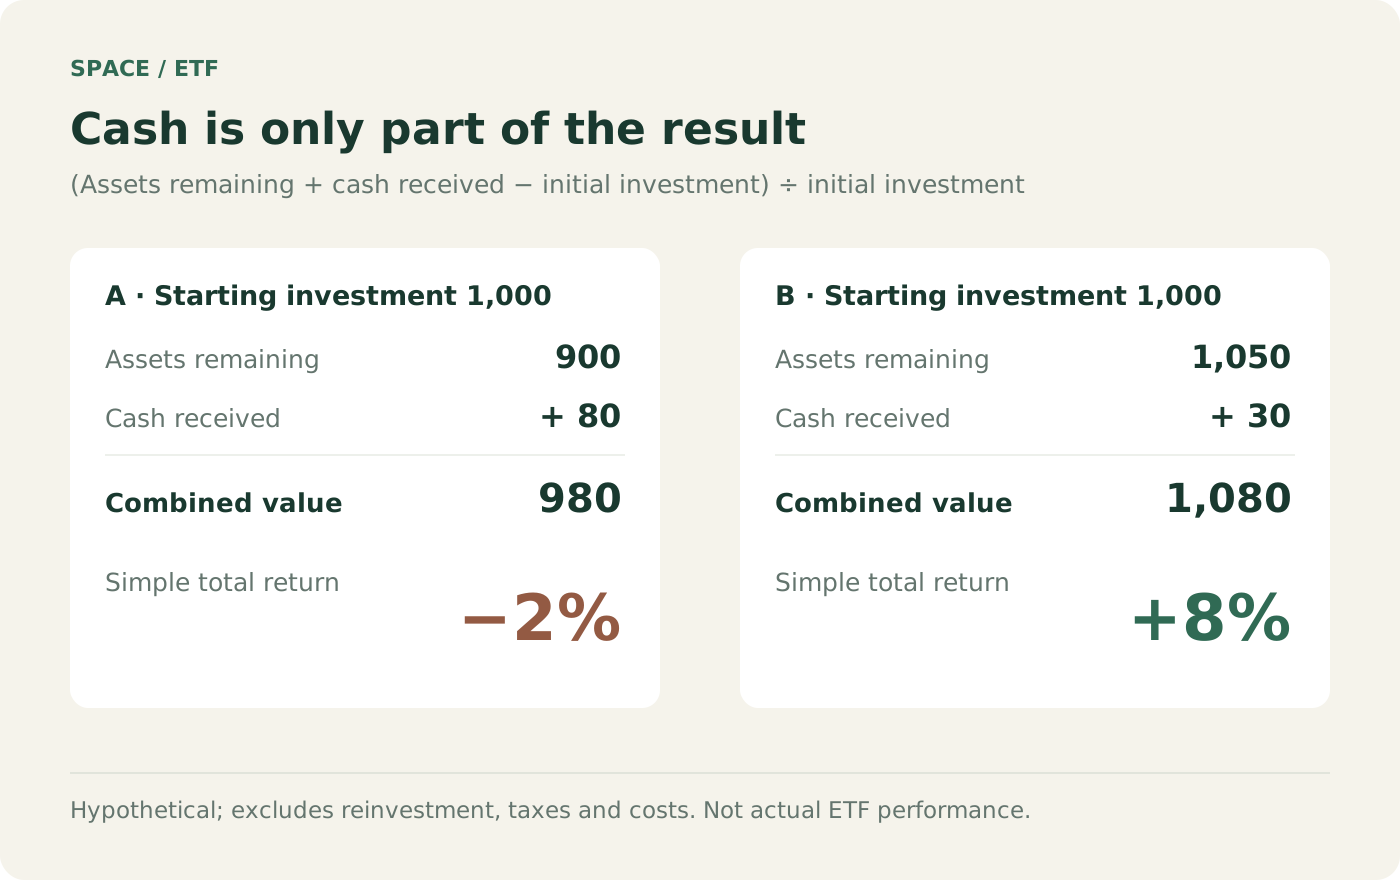
Suppose an invented investment starts at 1,000, pays out 80 and finishes with 900 still invested. The cash payment is real, but the two remaining pieces add to 980. Ignoring reinvestment, taxes and costs, that is a loss of 2%. Another investment could pay less cash and still deliver a better combined result through appreciation.
 View full-size figure (new tab) ↗
All else equal, the fund's net asset value adjusts for a distribution. Counting the cash received alongside the pre-distribution asset value counts the same money twice. The cash changed location; the payment alone did not create an extra asset outside the portfolio's economics.
This also explains why a steady payment history is not enough to establish sustainability. Examine the value of the assets supporting those payments. A shrinking base can matter even while the amount deposited still feels satisfying. Conversely, temporary fluctuations in net asset value need context rather than an instant conclusion about the entire strategy.
Reading return of capital carefully
The issuer provides Section 19(a) notices about estimated distribution composition. These may identify a portion as return of capital, or ROC, under US tax classifications. Monthly estimates can differ from the final classification reported after year-end.
ROC is neither automatic proof of economic destruction nor evidence of free, permanently tax-exempt profit. Tax character and economic performance answer different questions. Look at the capital remaining and total return alongside the tax document rather than turning a classification into a complete investment verdict.
Similarly, references to Section 1256 treatment for certain index options have a jurisdictional context. An issuer's explanation aimed at US taxpayers does not automatically describe a Korean resident's treatment in a Korean brokerage account. Residence, account type and individual circumstances matter. A blanket “tax-efficient for everyone” label omits those conditions.
Assets can grow faster than a track record
SPYI began in 2022. A larger asset base does not manufacture additional years of experience. A five- or ten-year history cannot yet be presented as this fund's actual live performance. Substituting an index's older returns may lengthen a chart but does not lengthen the ETF's life.
Useful observations include reinvested total return, the path of net asset value, and relative results in both rising and falling markets. At the moment of trading, also examine the bid-ask spread. A large fund does not guarantee a favorable execution for every order.
SPYI is an equity investment combined with options and a distribution policy. Reading it well starts by looking below the attractive percentage and asking what was included in the calculation—and what was left outside it.
Sources and dates
Reviewed on October 22, 2026. Observations belong to the dates stated in the text. Distributions and expenses can change.