You put the usual milk, eggs, and bread on the checkout counter. Nothing unusual has gone into the basket, yet the total is higher than you remember. On the way home, a headline on your phone says inflation is slowing. It sounds like good news. The receipt seems less convinced.
Neither the statistic nor your experience must be wrong. They may be answering different questions.
The first distinction is between the level of prices and the speed at which prices are rising. Much of the confusion about inflation disappears once those are separated.
Rising more slowly still means rising
Suppose a basket costs 100,000 won at the starting point and 105,000 won a year later. Its price has risen by 5%. Now imagine that inflation slows to 2% in the following year.
The basket does not return to 102,000 won. The 2% increase applies to the new starting point of 105,000. Its price becomes 107,100 won.
| Point in time | Cost of the same basket | Change from previous year |
|---|---|---|
| Starting point | KRW 100,000 | — |
| One year later | KRW 105,000 | +5% |
| Two years later | KRW 107,100 | +2% |
An invented fixed basket, not an official consumer price series.
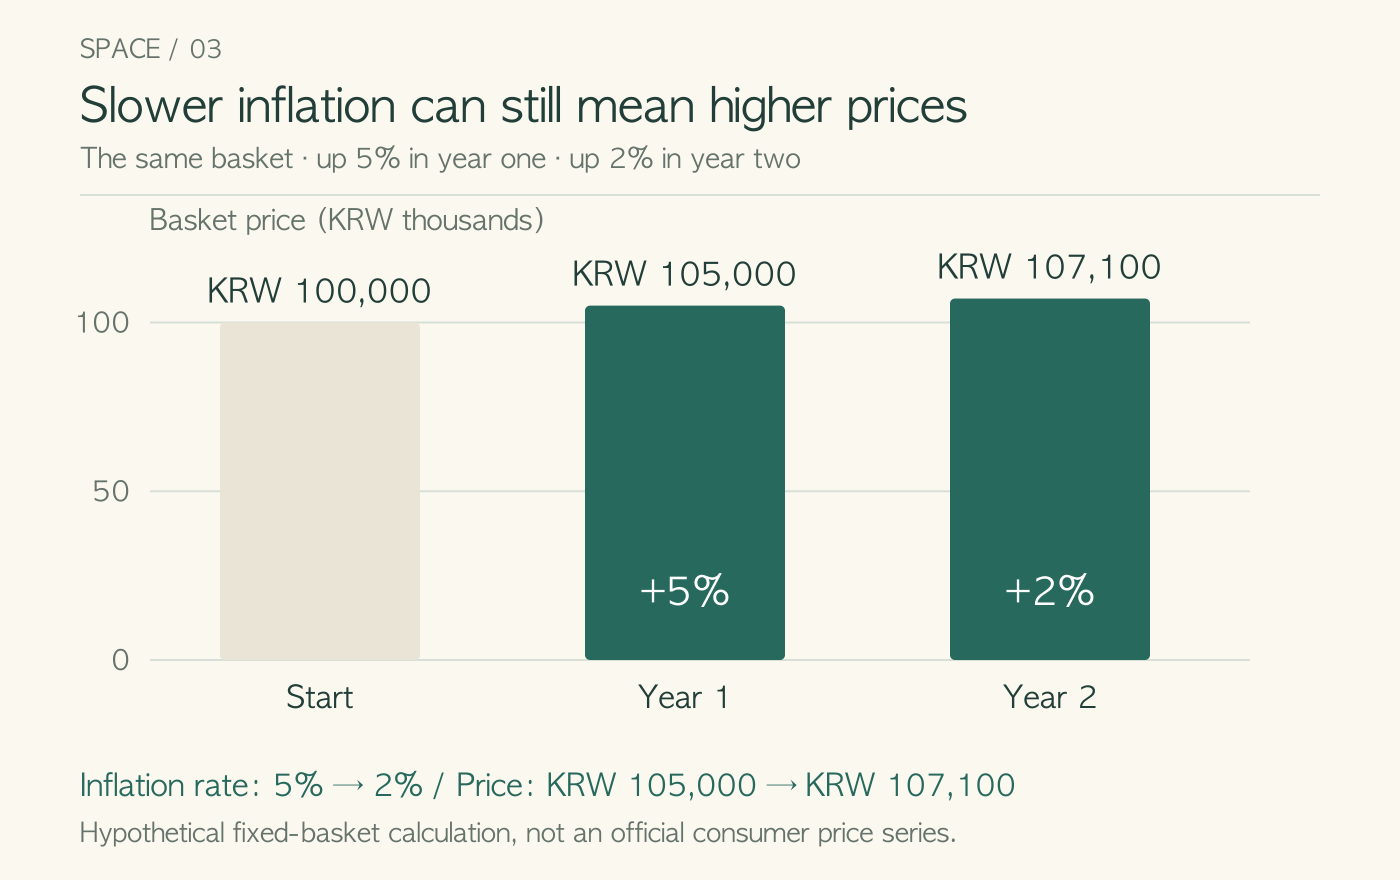
Figure: an original illustration based on the assumptions and calculations in the text.
The slowing from 5% to 2% is called disinflation. Deflation is a sustained decline in the general price level. One vegetable becoming cheaper for a week does not establish economy-wide deflation. Inflation concerns prices across a broad range of goods and services. IMF explanation of inflation
There is another distinction worth noticing: percentages and percentage points. A rate falling from 5% to 2% has declined by 3 percentage points. Relative to its original value of 5%, the rate is 60% lower. These describe the same change using different denominators. When a headline feels surprisingly dramatic, check which unit it uses.
The average basket is not your basket
The consumer price index, or CPI, combines many prices into one measure. Items are weighted to reflect spending patterns rather than treated as equally important. Coverage and methodology vary across statistical systems.
Nobody buys exactly the average basket. A driver is exposed to fuel costs differently from someone who uses public transport. A renter may experience housing expenses differently from a homeowner with a fixed mortgage payment. The US Bureau of Labor Statistics explains that a household’s spending mix can cause its personal inflation experience to differ from the CPI. BLS CPI questions and answers
Consider a simplified household that spends 40% of its budget on food and 60% on everything else. If food prices rise 10% and other prices rise 2%, the cost of keeping the same quantities rises about 5.2%.
40% × 10% + 60% × 2% = 5.2%
This two-category example is not a reproduction of an official CPI formula. It simply shows why weights matter. The item that dominates one household’s budget may play a small role in another.
Quantity matters as well. A 15% increase in your monthly food bill does not prove that food prices rose 15%. You may have eaten out more often or bought more expensive ingredients. Track a few familiar products in the same sizes and quantities to begin separating price changes from changes in your own choices.
A larger balance can buy less
Return to the interest payment from the previous lesson. You deposit 1 million won and have 1.04 million after a year. Your nominal return is 4%.
If the relevant basket of prices rises 5%, something that cost 1 million won now costs 1.05 million. Your balance has grown, but it no longer buys the entire basket.
The real return, measured in purchasing power, is approximately −0.95%.
Real return = (1 + nominal return) ÷ (1 + inflation) − 1
1.04 ÷ 1.05 − 1 ≈ −0.95%
For relatively small rates, subtracting inflation from the nominal return gives a useful approximation. Here, 4% minus 5% is −1%. The division gives the exact result under these assumptions. Taxes and fees can reduce the return retained before we even make the inflation adjustment.
Wages can be examined in the same way. If nominal pay rises 3% while the cost of your usual living expenses rises 5%, maintaining the same lifestyle may become harder. A bigger number on a payslip and an improvement in purchasing power are different developments.
Similar price increases can begin in different places
Prices may rise because demand grows faster than production can respond. They may also rise because supply is disrupted or production becomes more expensive. Several causes can operate together.
Imagine a small bakery near a new office building. More customers arrive each morning, but the bakery still has one oven. The owner may find that higher prices do little to reduce demand.
Now imagine the customer count stays unchanged while flour and electricity become more expensive. The owner may again raise prices, this time because the old price leaves too little margin. The price change looks similar to a customer, but the business problem is different.
Expectations also influence decisions. If firms expect ongoing cost increases, they may adjust prices in advance. Workers may seek wages that account for expected living costs. How strongly these responses spread depends on competition, contracts, productivity, and labour-market conditions.
This is why the next question after “prices rose” should be “which prices?” Food, energy, and a broad collection of services can tell different stories. A narrow disruption and a widespread increase should not automatically lead to the same interpretation.
Last year is part of this year’s headline
A year-over-year inflation figure compares two periods: the current one and the same period a year earlier. An unusually high or low starting point can make today’s change look surprisingly small or large. This is often called a base effect.
Suppose one item cost 100 in January last year, then jumped to 120 in February. This year, it costs 120 in both January and February.
The year-over-year increase is 20% in January and zero in February. Nothing became cheaper during those two months this year. The earlier comparison point changed.
Month-over-month data can help reveal more recent movement. But seasonal patterns matter too. Holidays, travel seasons, and predictable weather effects can change spending and prices. Check whether the series is seasonally adjusted before comparing figures, and avoid turning one month into a confident forecast.
An index is also a relative measure. A price index of 120 is not a bill for 120 units of currency. It indicates a level relative to the index’s chosen base. Before comparing two countries’ index levels, check their bases and methods. A higher index number does not by itself establish which country is more expensive.
The next time you read an inflation report, write down three things: what moved, which period it was compared with, and how much of your own spending it affects. The exercise will not predict next month’s grocery bill. It will give you a more precise question than “why does everything feel expensive?”
That precision is useful elsewhere. Interest income, salary increases, and a savings goal twenty years away all need to be understood in terms of what the money can buy. The receipt and the headline can then become two parts of the same explanation.